
The hardship test
The hardship test does not fire until the payor is at 57 percent of net income
While Section IV.C presumes hardship once a support order reaches 40 percent of the payor's income, the Worksheet tests that threshold by dividing the order by a figure computed before tax, and the order itself is paid from what's left after tax.
At the worked example, the test does not fire until the payor is at 57 percent of net income.
Percentage points between what the hardship test reports and what the order really takes of take-home pay, at the moment the test finally fires
Verified against the form's own calculation scripts
The worked example throughout (the payor, the $201,000 income, the child care figures) runs three children, the payor's income and the other parent's income entered as the Worksheet requires. I pay child support in Massachusetts myself, so I have a stake in the outcome; a reader should be able to check whether the arithmetic changes when the numbers move. It doesn't: the same 17-point gap holds across the income and child-care ranges charted below as well as at this example's figures.
The model behind every number on this page is model/worksheet.py, checked by model/test_worksheet.py against the form's own calculation scripts, with the printed run behind the table below.
The hardship test divides the order by income measured before tax, while the order is paid after tax
Worksheet Line 7e divides Line 7d (the presumptive order) by Line 3a (available income) and flags the result once it reaches 40 percent, triggering Section IV.C’s rebuttable presumption of hardship. Line 3a is gross income minus a short list of specific deductions, existing support orders and health and dental premiums for the children, and not one of them is a tax. So Line 7e answers a question about spendable income with a figure that carries no tax adjustment at all.
While federal law requires every order to rest on what a parent can actually pay, this is the Worksheet’s one test for that, and it measures the wrong income. See the Ability to pay finding.
The gap holds at every income level and every level of child care claimed
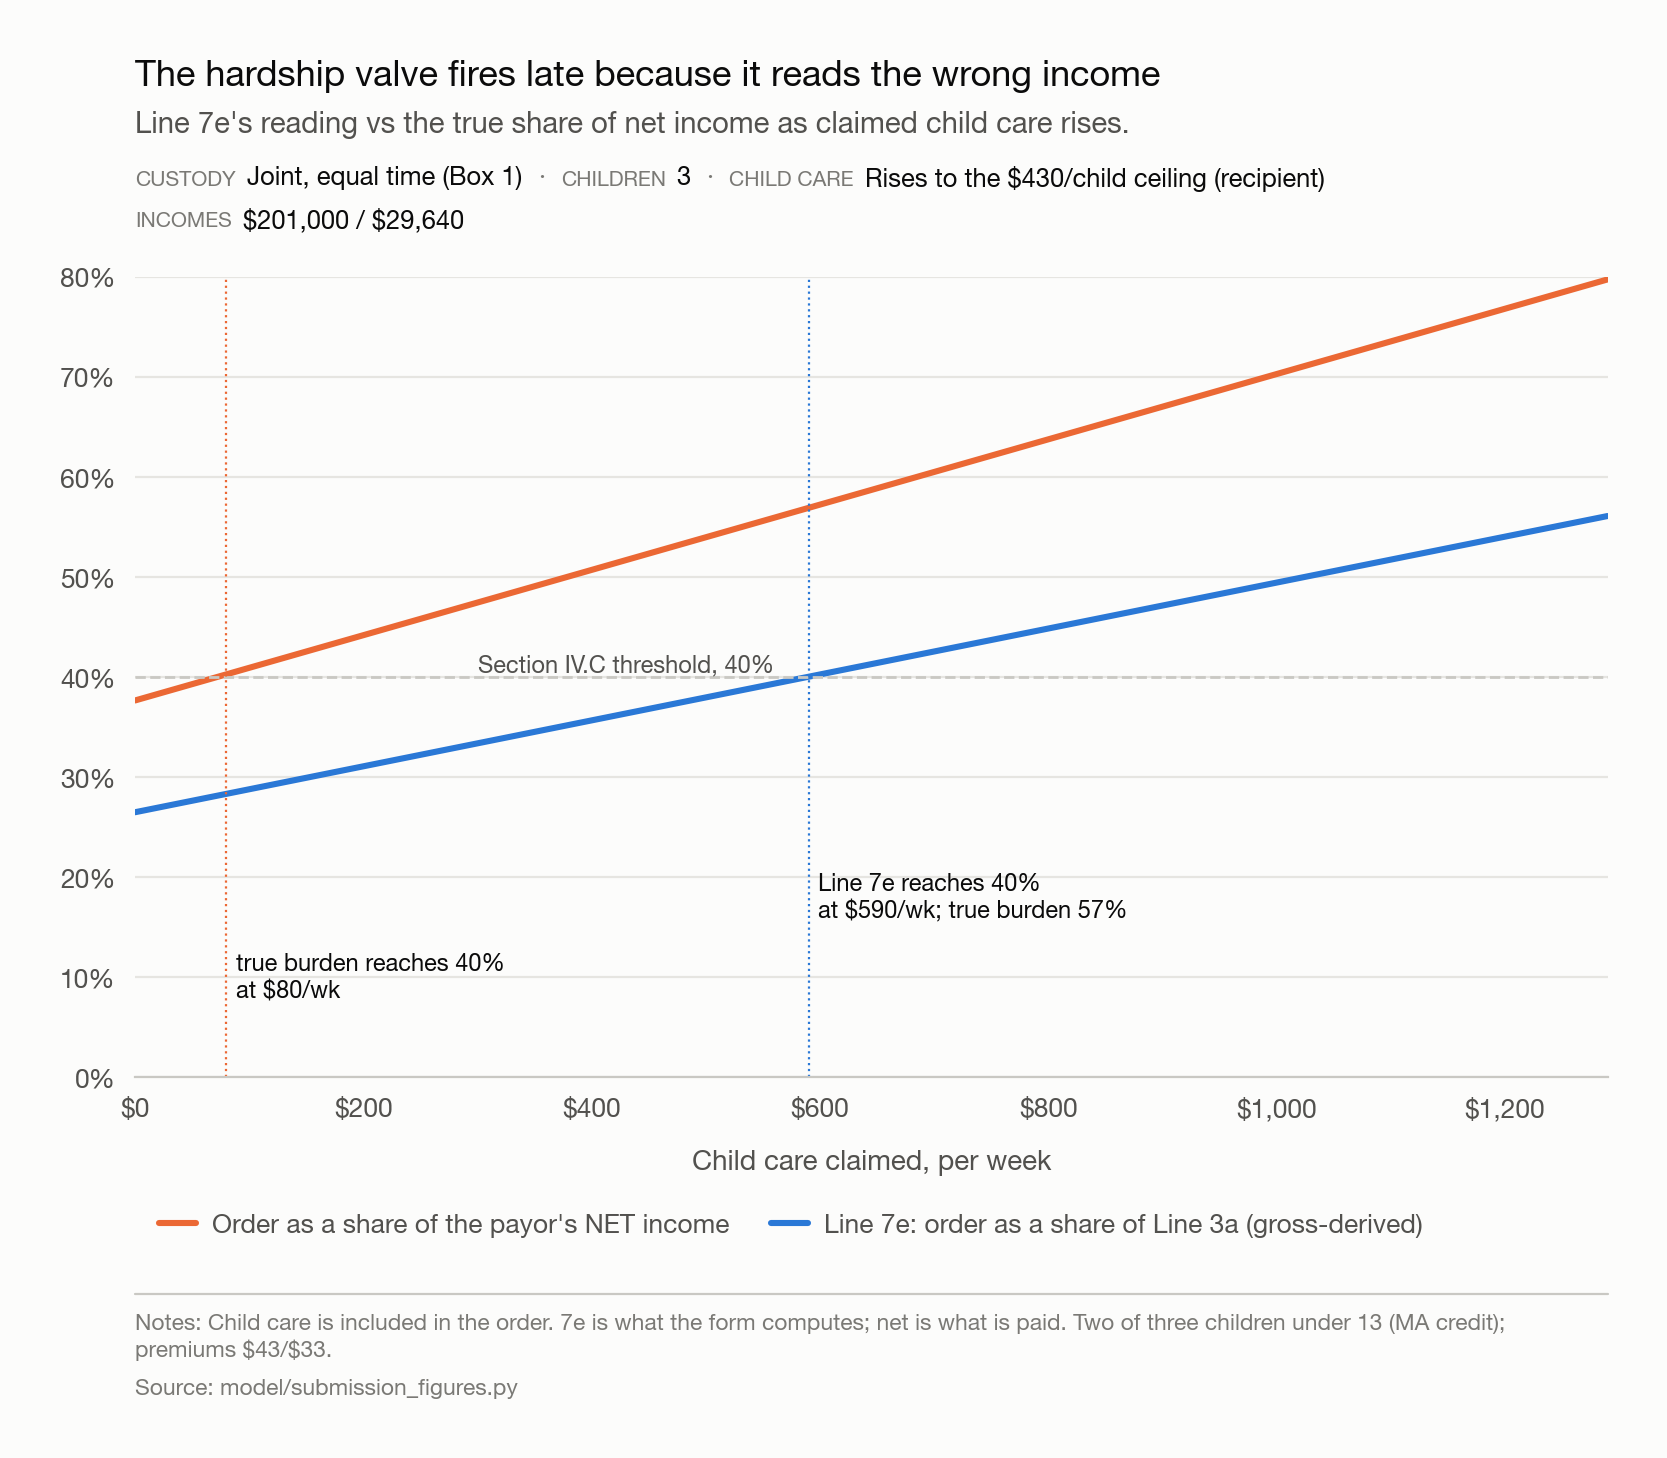
The hardship test fires late because it reads the wrong income.
At the worked example, Line 7e divides the order by gross-derived available income while the order is paid from net income.
As child care claimed by the recipient rises, the true burden passes 40 percent of net at $80 a week of child care; Line 7e reports 40 percent at $589 a week, by which point the true burden is 56.9 percent. Nothing on the form flags the gap.
Source: model/charts/fig6_valve.py ·
data (CSV)
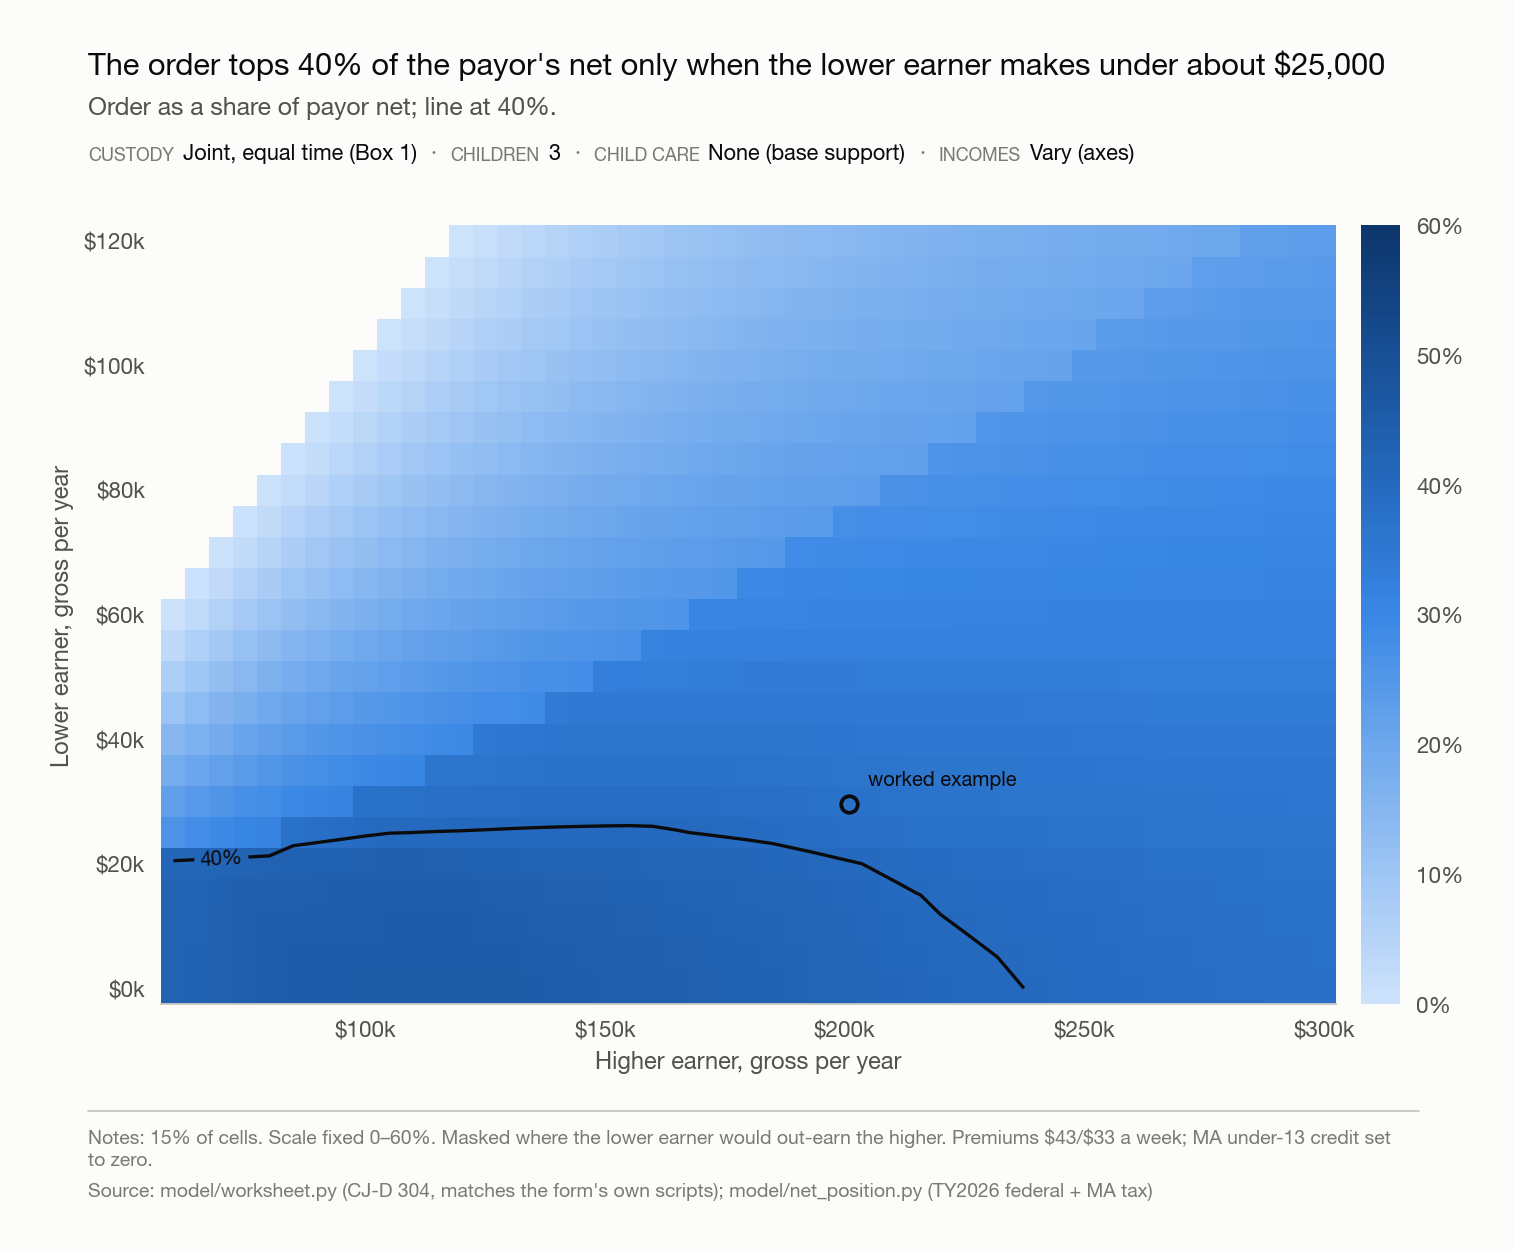
The order exceeds 40 percent of the payor's net income only where the lower earner makes about $20,000 or less.
Order as a share of the payor's net income, three children, Box 1 (equal parenting time), across a grid of both incomes.
The 40 percent contour, computed on net income, sits at a lower-earner income of about $20,000, up to roughly $205,000 of higher-earner income; above that the order never reaches 40 percent of net on the grid. Section IV.C's hardship presumption targets this region; the chart above shows what the Worksheet reports there.
Source: model/charts/fig1_heatmaps.py ·
data (CSV)
Every row of the lag, and how the hardship test (Line 7e) computes each one
The table below holds base support fixed and raises the recipient’s claimed child care from $0 to the statutory ceiling for three children ($1,290 a week), tracking what Line 7e reports against the payor’s true share of net income at each point.
| Child care claimed | Order | Order (annual) | Line 7e reads | True share of net |
|---|---|---|---|---|
| $0/wk | $1,013/wk | $52,662/yr | 26.5% | 37.7% |
| $100/wk | $1,100/wk | $57,221/yr | 28.8% | 40.9% |
| $300/wk | $1,276/wk | $66,340/yr | 33.4% | 47.4% |
| $589/wk | $1,529/wk | $79,506/yr | 40.0% | 56.9% |
| $1,290/wk (ceiling) | $2,144/wk | $111,479/yr | 56.1% | 79.7% |
Line 7e does not reach 40 percent until $589 a week of claimed child care, 46 percent of the $1,290
statutory ceiling for three children, by which point the payor’s true burden is 56.9 percent of
net income. That 17-point lag narrows as claimed child care falls, to about 12 points at $100 a
week. (Source: model/runs/submission-figures-run-2026-09-09.txt, printed by
model/submission_figures.py.)
This is one worked example, and per person the payor still holds more almost everywhere
The presumption does eventually fire, 17 points late, once claimed child care reaches $589 a week for three children. The Guidelines allow up to $1,290, and a claim that size is not typical. This is one worked example, and how often actual claims sit near that benchmark is not known from anything in this repository.
Per person, the payor remains ahead. Across the full grid behind the heatmap above, the payor holds more per person than the recipient's household in 98.9 percent (1,134 of 1,147) of the modelled cells, and holds more per household too in all but 114 of them. The recipient's household still holds more in total in the remaining 9.9 percent (114 of 1,147).
Check it yourself
The Line 7e figures above are pinned by the worksheet's own test suite, not asserted from a chart.
model/worksheet.pyThe line-by-line implementation, transcribed from form CJ-D 304 (12/01/2025) and checked against the form's own calculation scripts.model/test_worksheet.pyPins Line 7e's behavior as child care rises, including that it does not fire at $300/week ("7e ≈ 33.4%") and that it rises monotonically with claimed child care.- The printed run The output behind the table above.
- fig6_valve_units_lag.csv The 130-row data file behind the line chart.