
Every exhibit here is a single chart, drawn from a committed script, with its plotted values linked beside it
Many charts below use a fixed worked example: $201,000 and $29,640 a year, three children,
computed under Massachusetts's 2025 Worksheet. I pay child support in Massachusetts myself, so I
have a stake in the outcome, and I disclose it so you can check the arithmetic yourself. Where a
chart sweeps a range of incomes, this example's
figures are marked as one point among many. The worksheet behind these figures is
model/worksheet.py, checked against the official
form's own scripts on the model page. These figures were built for the
working paper and the public comments; see the model for the scripts
behind both.
Every chart below has one set of axes. An earlier set mixed several panels into one image, and those have been split into the single-chart figures listed here. The fact line under each title gives the custody arrangement, number of children, child care and incomes the chart was computed with. One worked example does not generalize to every family, and a household comparison always carries its per-person counterpart.
Contents
- The Massachusetts guidelines can set child support higher than federal law lets the state collect from wages.
- The more child care is claimed, the further the order goes over the federal limit on wage withholding.
- At $100 a child, 10.6% of income pairs produce an order over the federal limit on wage withholding.
- With three children, the recipient household holds more after the order in 10 percent of income combinations.
- Per person, the payor holds more almost everywhere.
- With one child, the recipient household holds more after the order in no income combinations.
- With two children, the recipient household holds more after the order in 4 of 1,147 income combinations (0.3 percent).
- The order exceeds 40 percent of the payor’s net income only where the lower earner makes about $20,000 or less.
- The hardship test fires late because it reads the wrong income.
- Of the payor’s next dollar, the payor keeps between a third and a half.
- The order passes 40 percent of net pay in 473 of 1,147 income combinations.
- The payor’s share of a $15,600 child care bill, three ways to split it.
- With one child, splitting child care on income after the order funds the payor 17 points below the payor’s income share.
- With two children, splitting child care on income after the order funds the payor 24 points below the payor’s income share.
- With three children, splitting child care on income after the order funds the payor 29 points below the payor’s income share.
- The payor bears 93 percent of the combined child care while earning 87 percent of the gross income.
- Both parents paying child care costs the payor $29,008 a year, the recipient household $2,192.
- The Worksheet’s equal-time credit collapses as the income gap widens.
- The equal-time credit is what a standard formula pays a parent who has the children one night in three.
- Splitting two children across two homes cuts the weekly order by 30 percent.
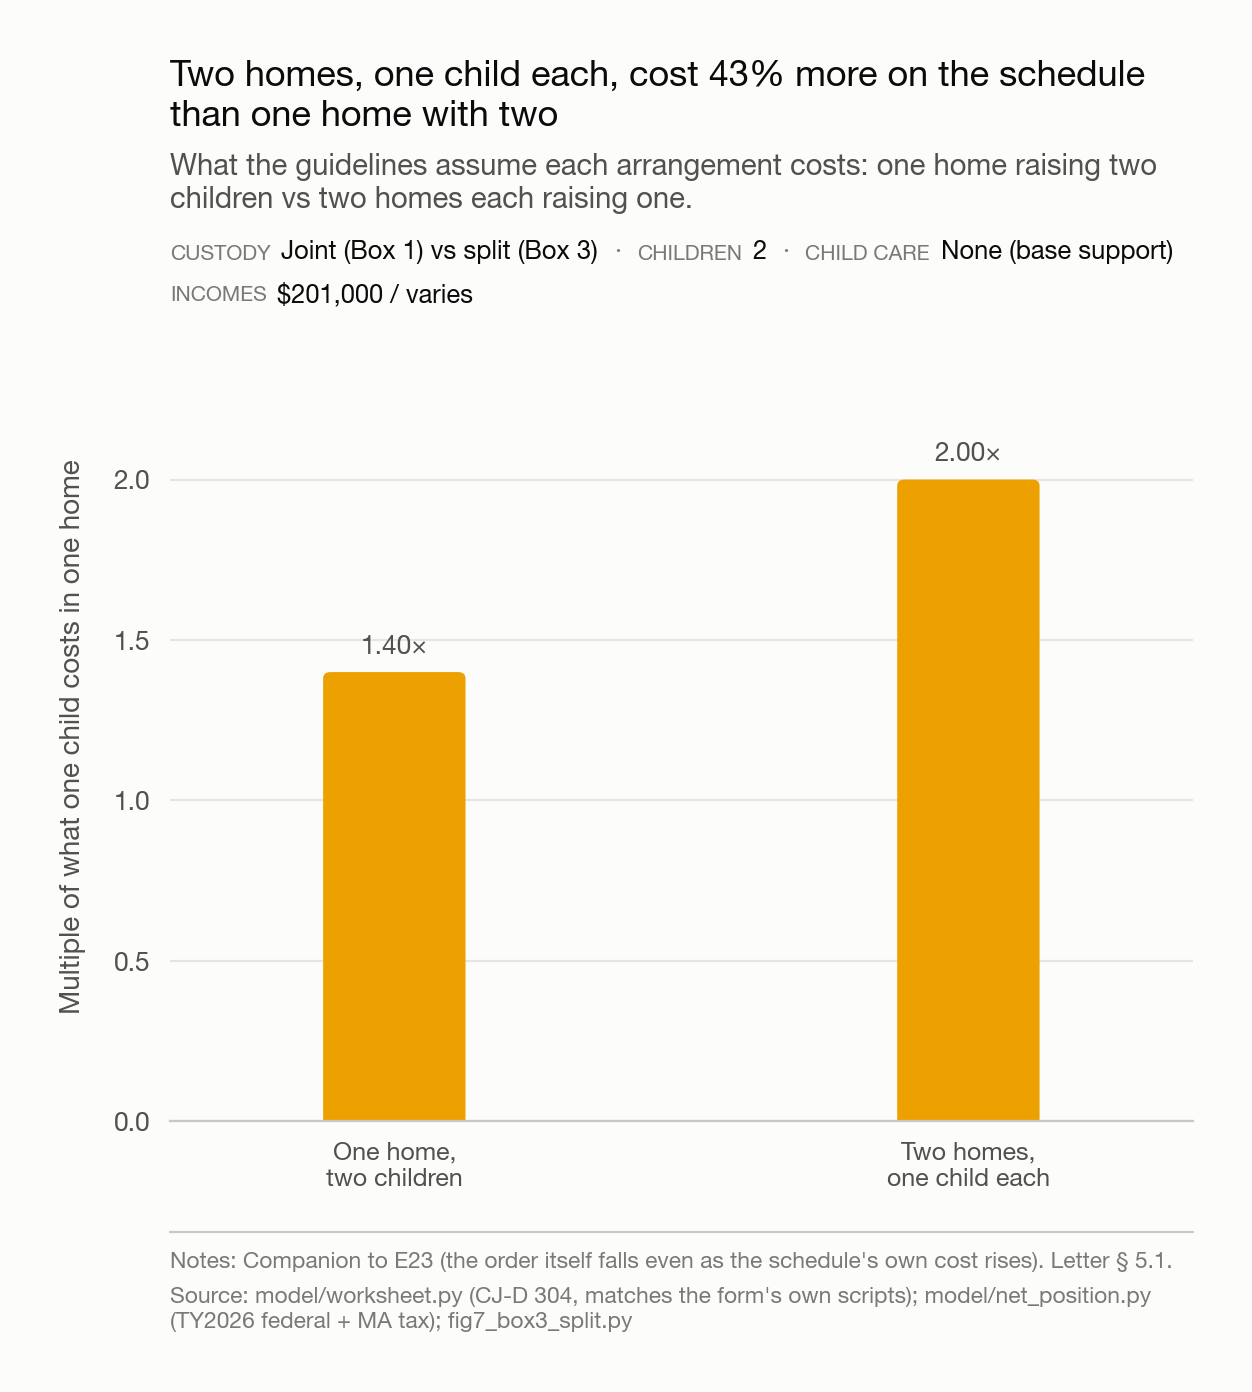
- Two homes, one child each, cost 43 percent more on the schedule than one home with two.
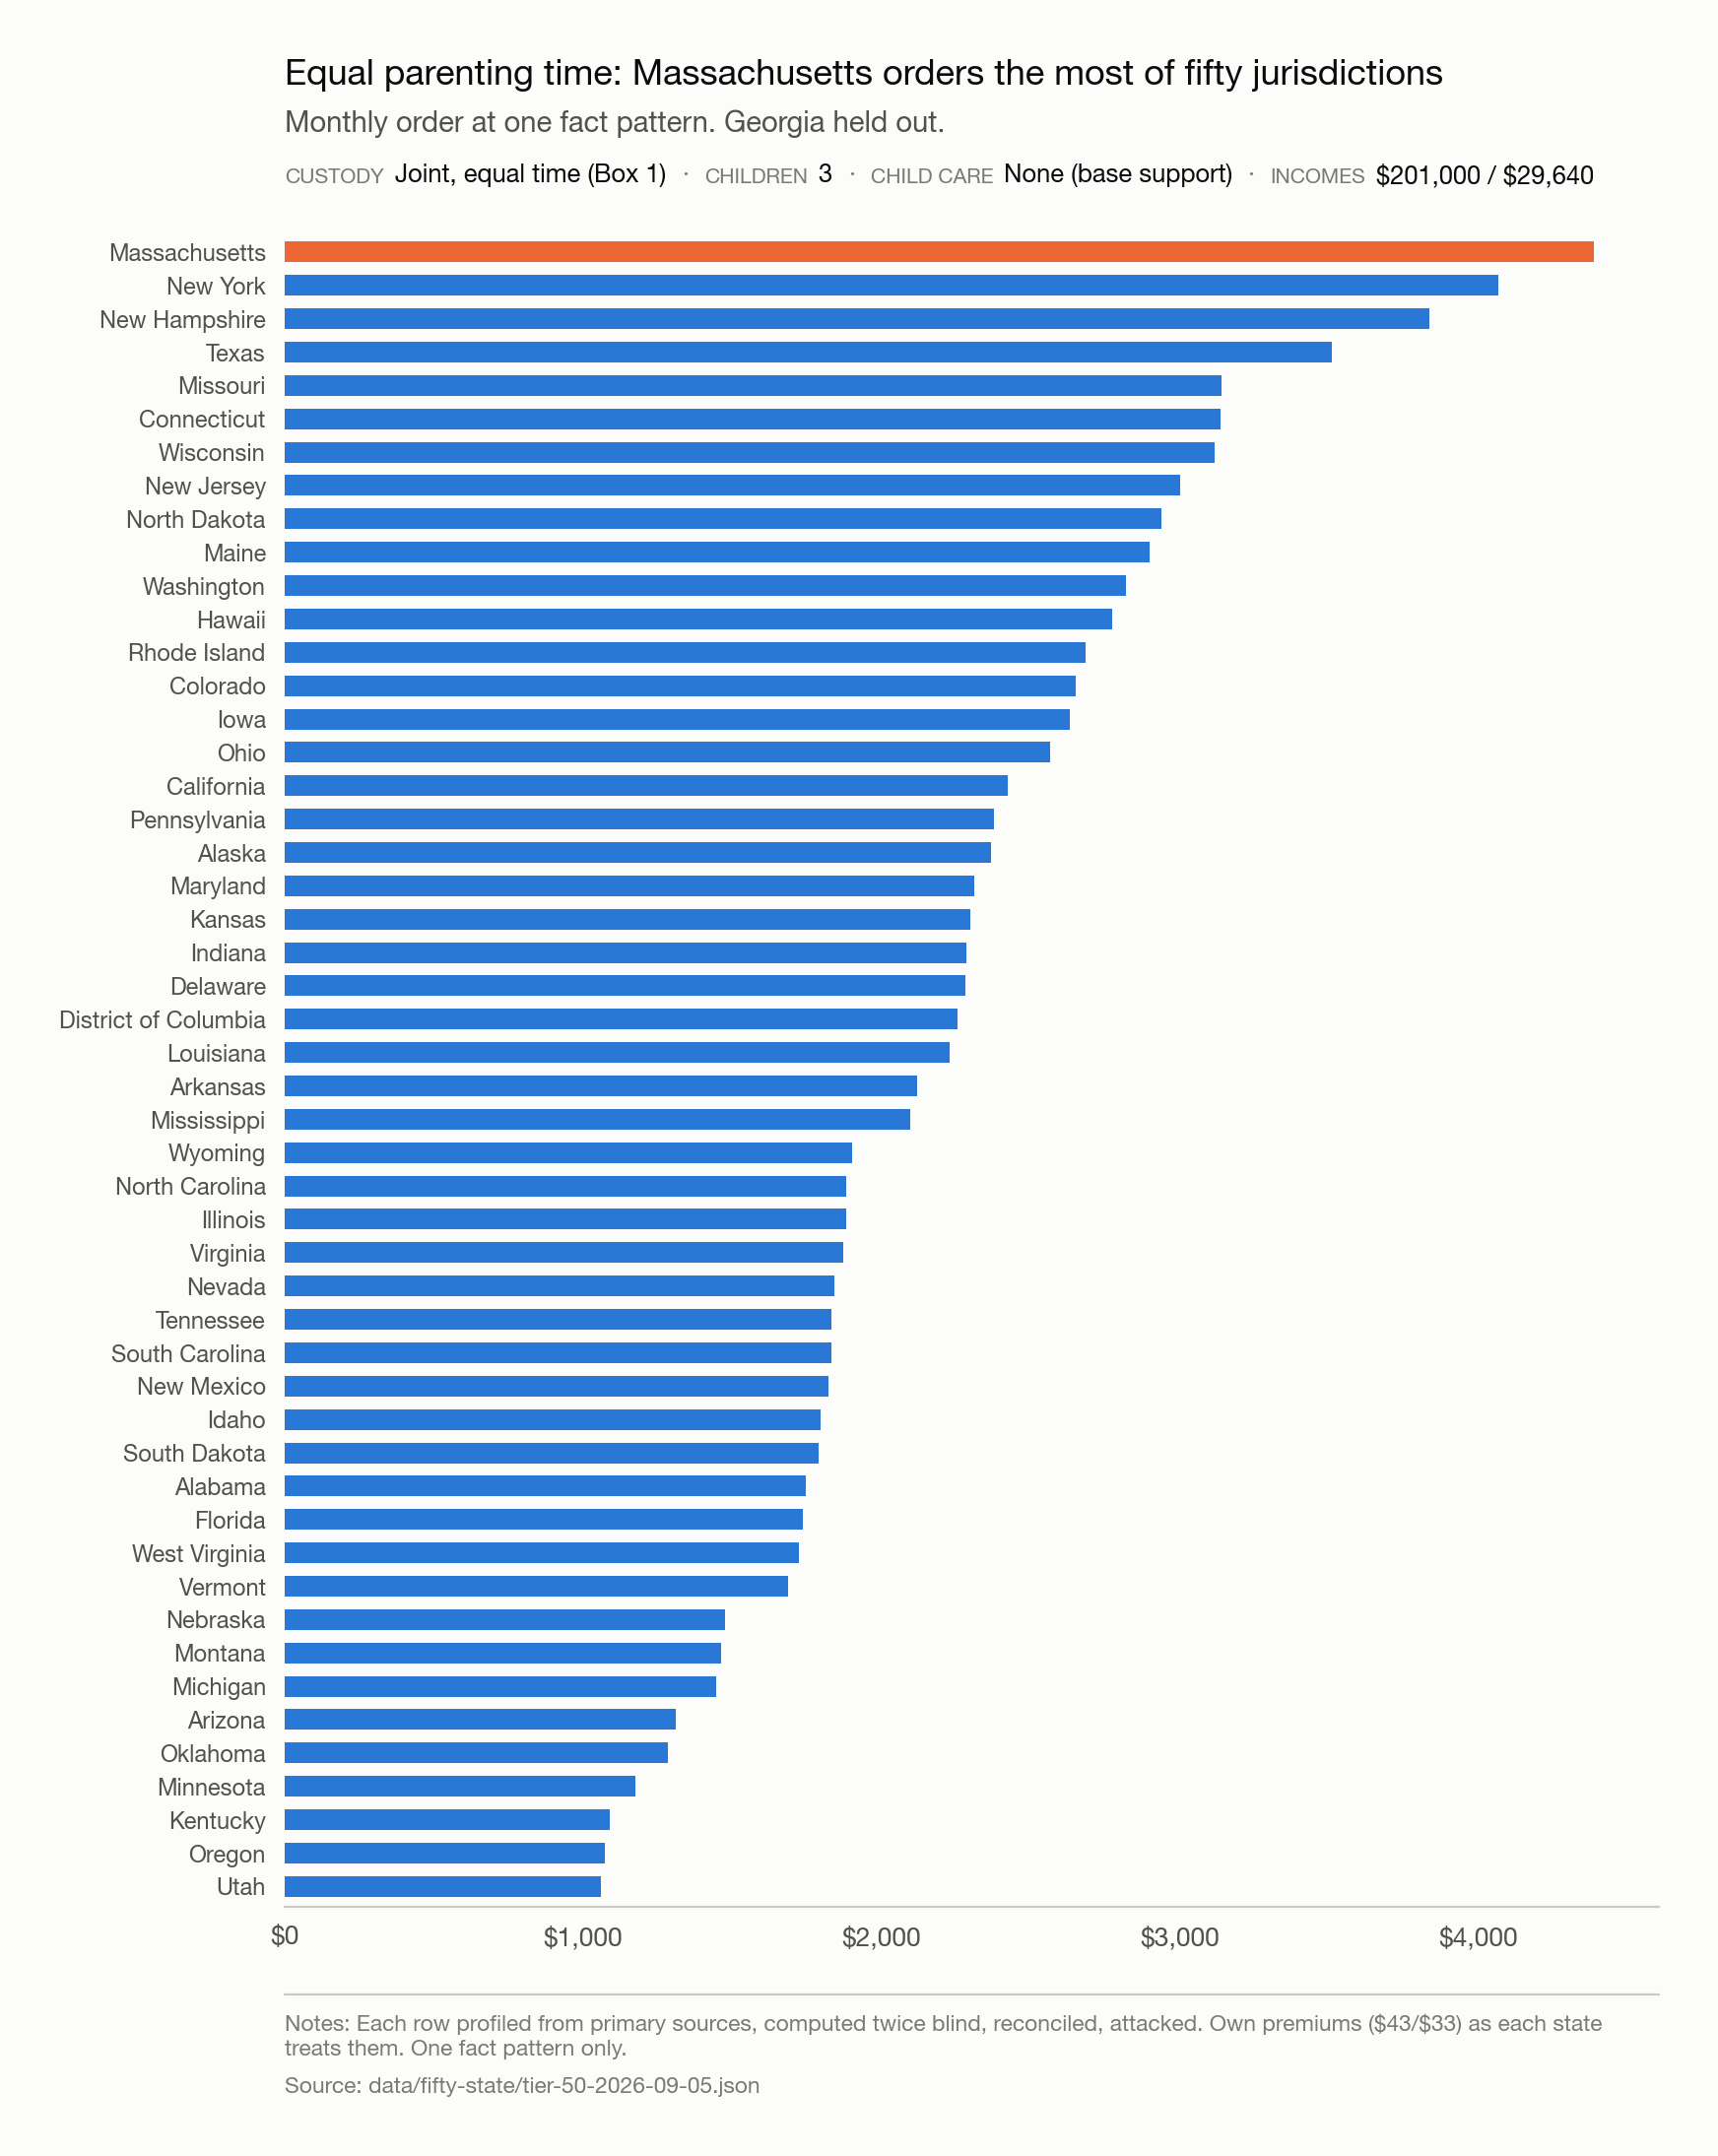
- At equal parenting time, Massachusetts orders the most of the fifty states.
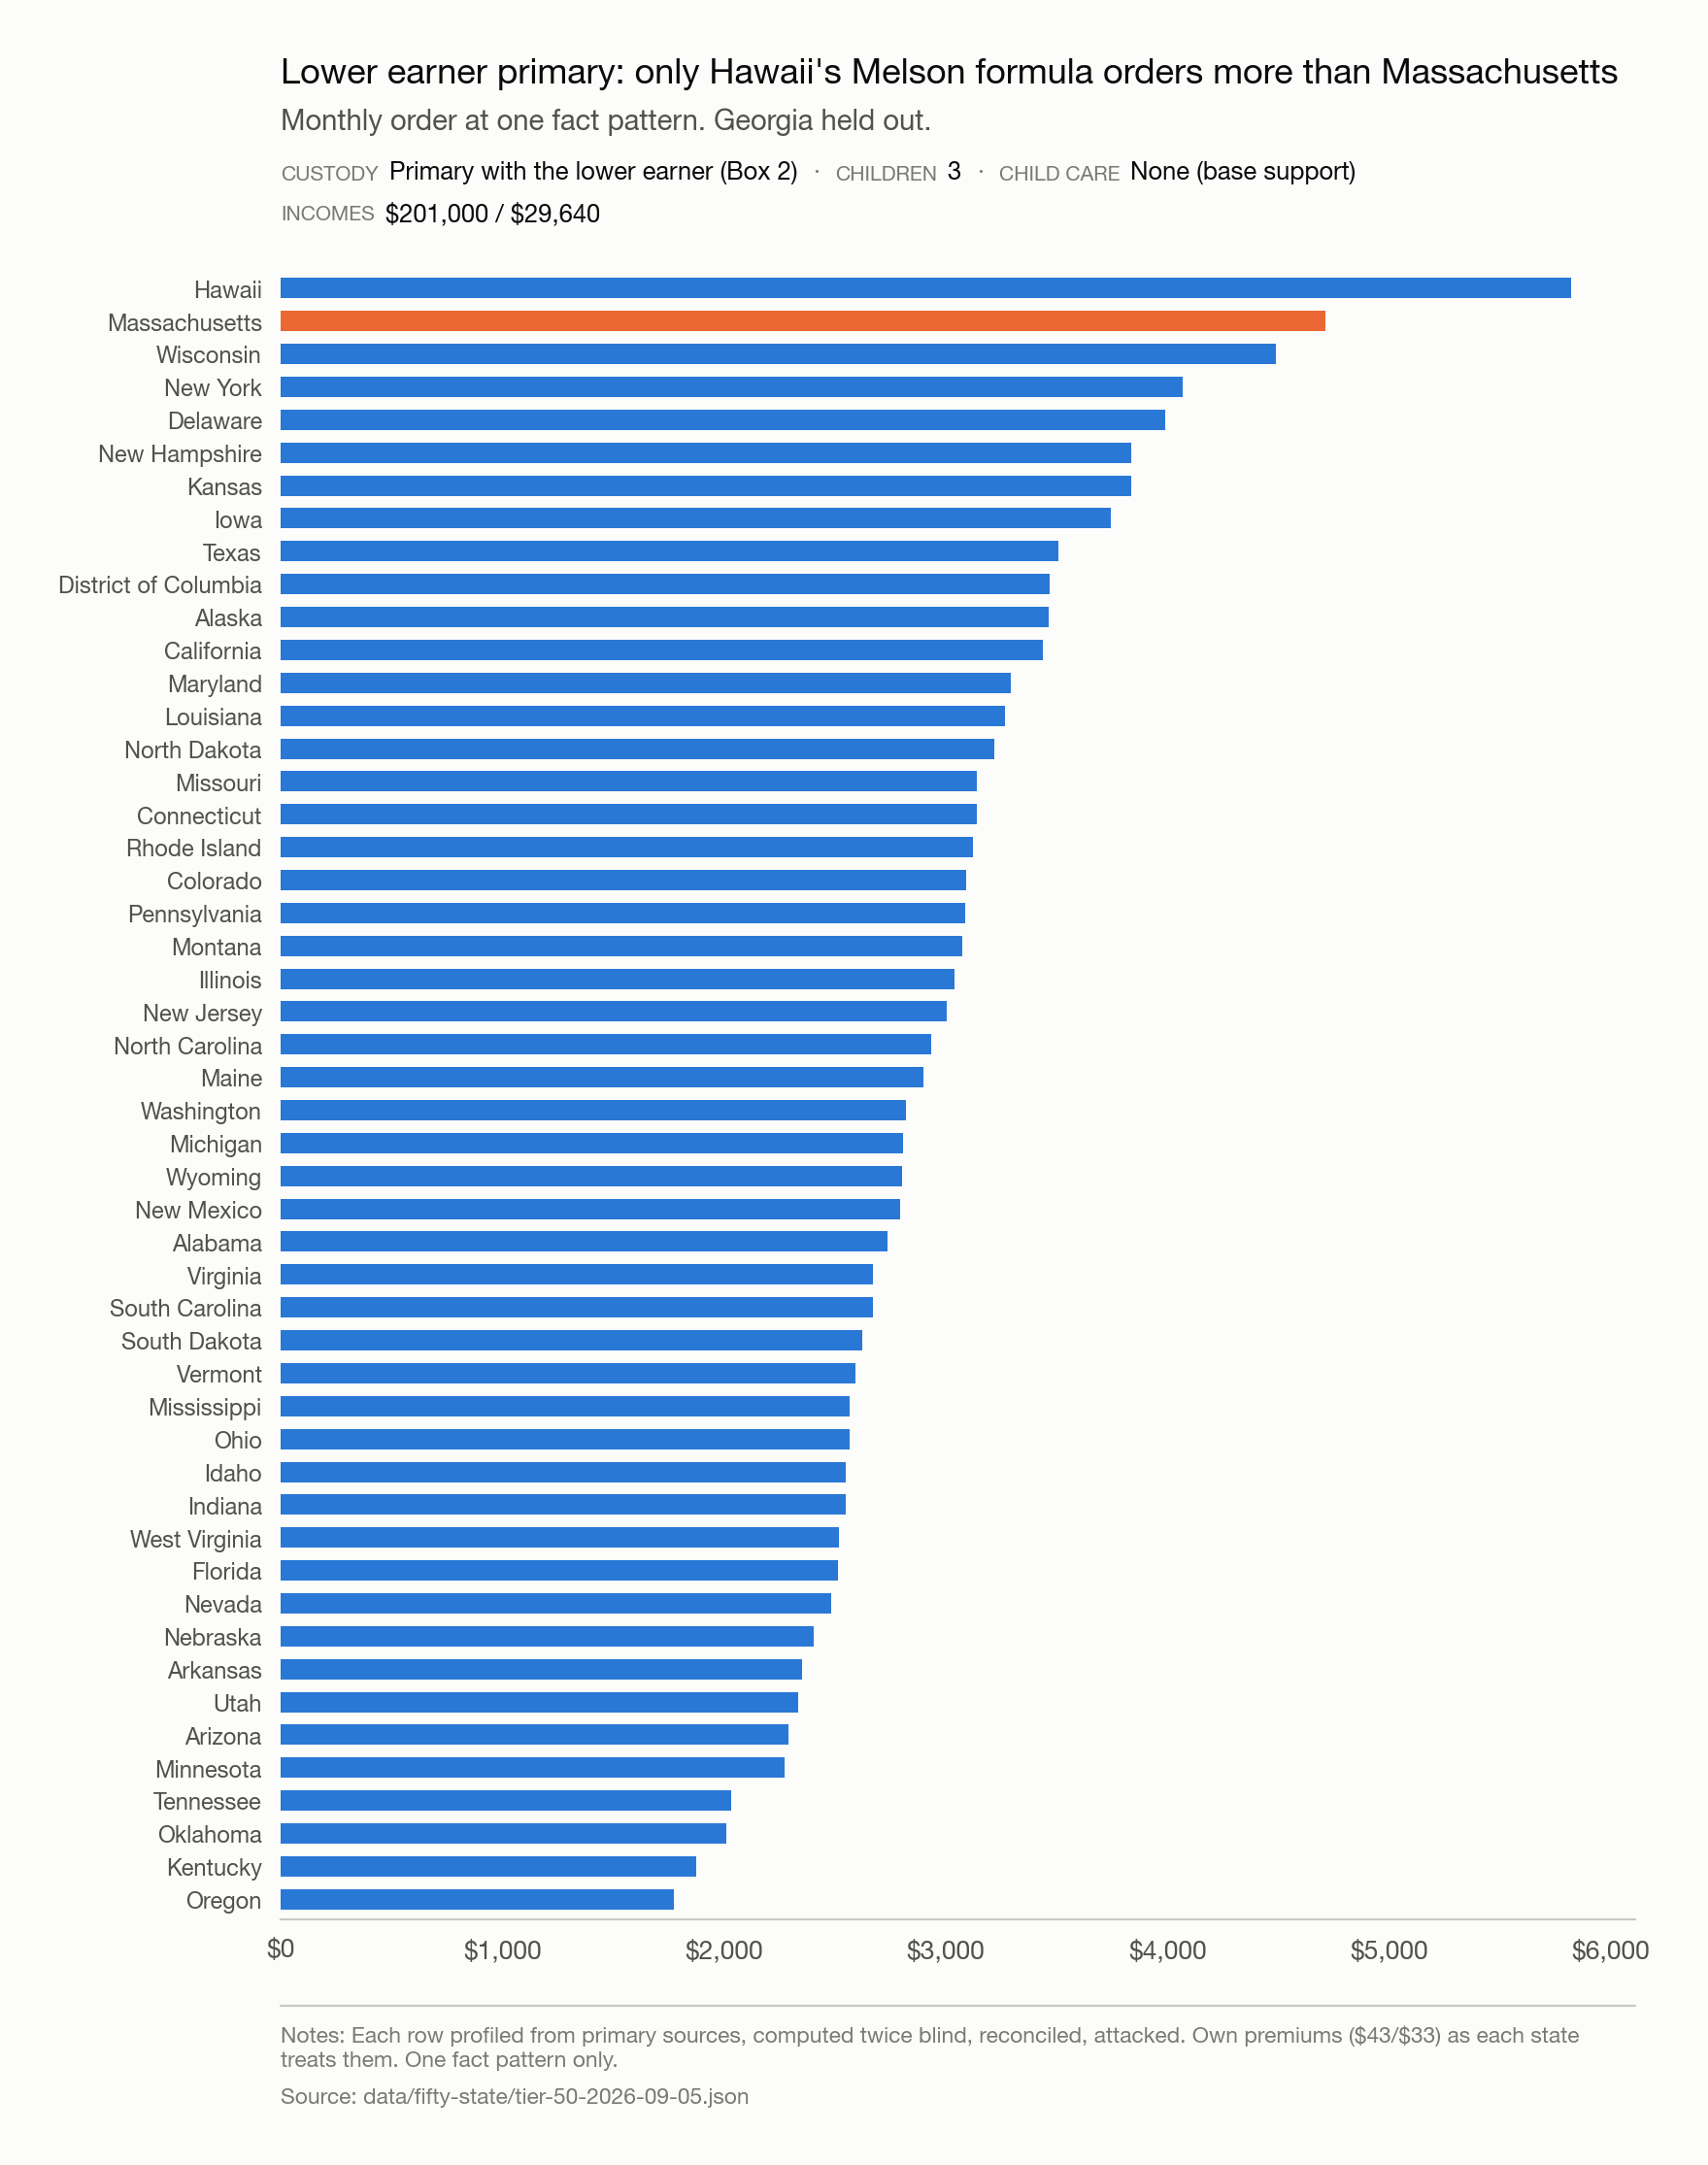
- With the lower earner primary, only Hawaii orders more than Massachusetts.
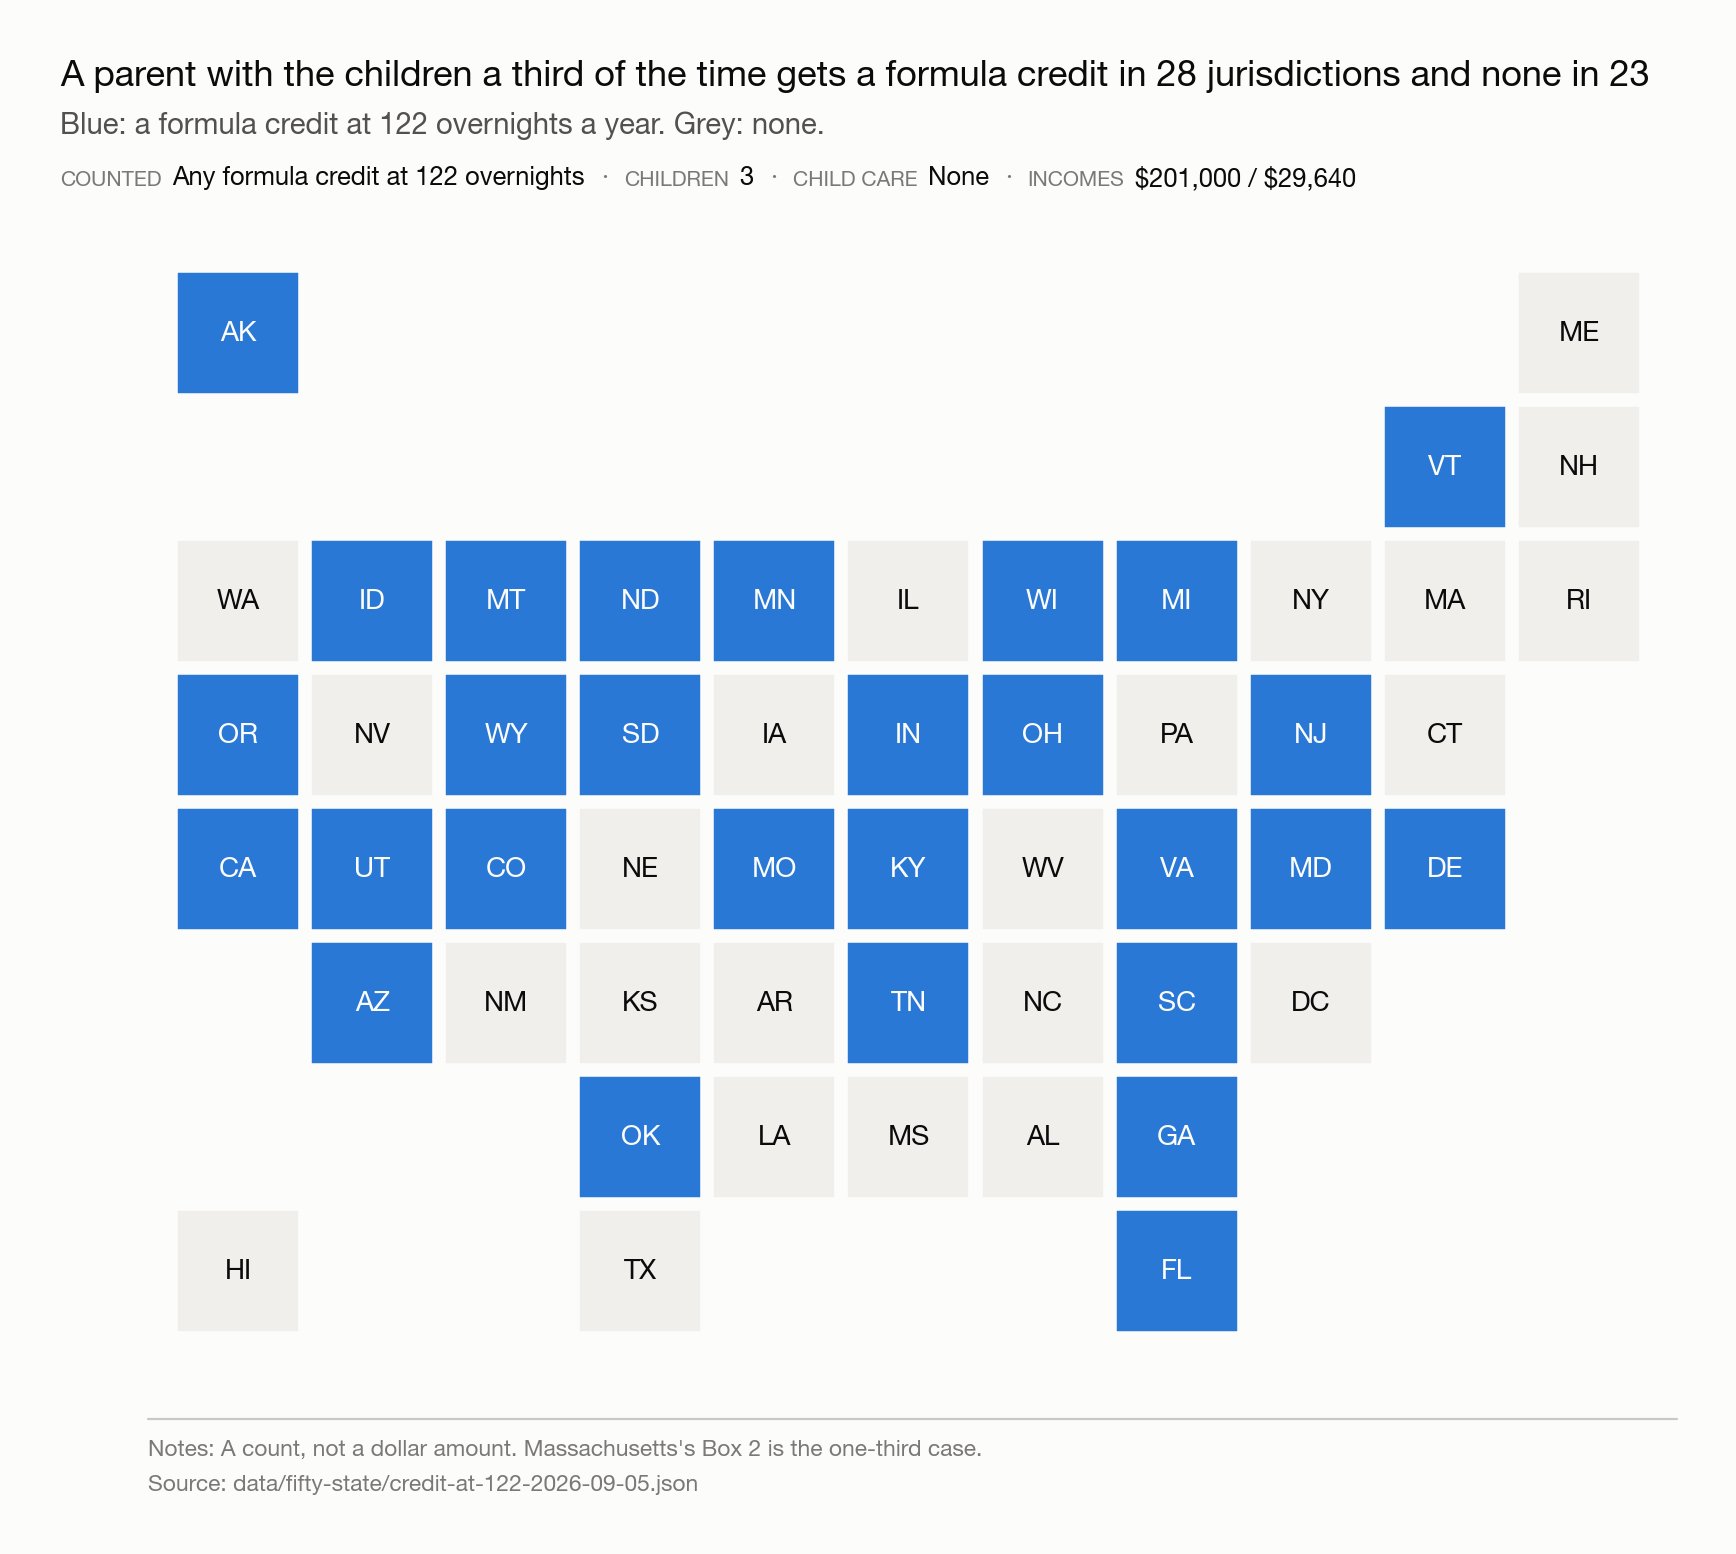
- In Massachusetts and 22 other states, having the children a third of the time lowers the order by nothing.
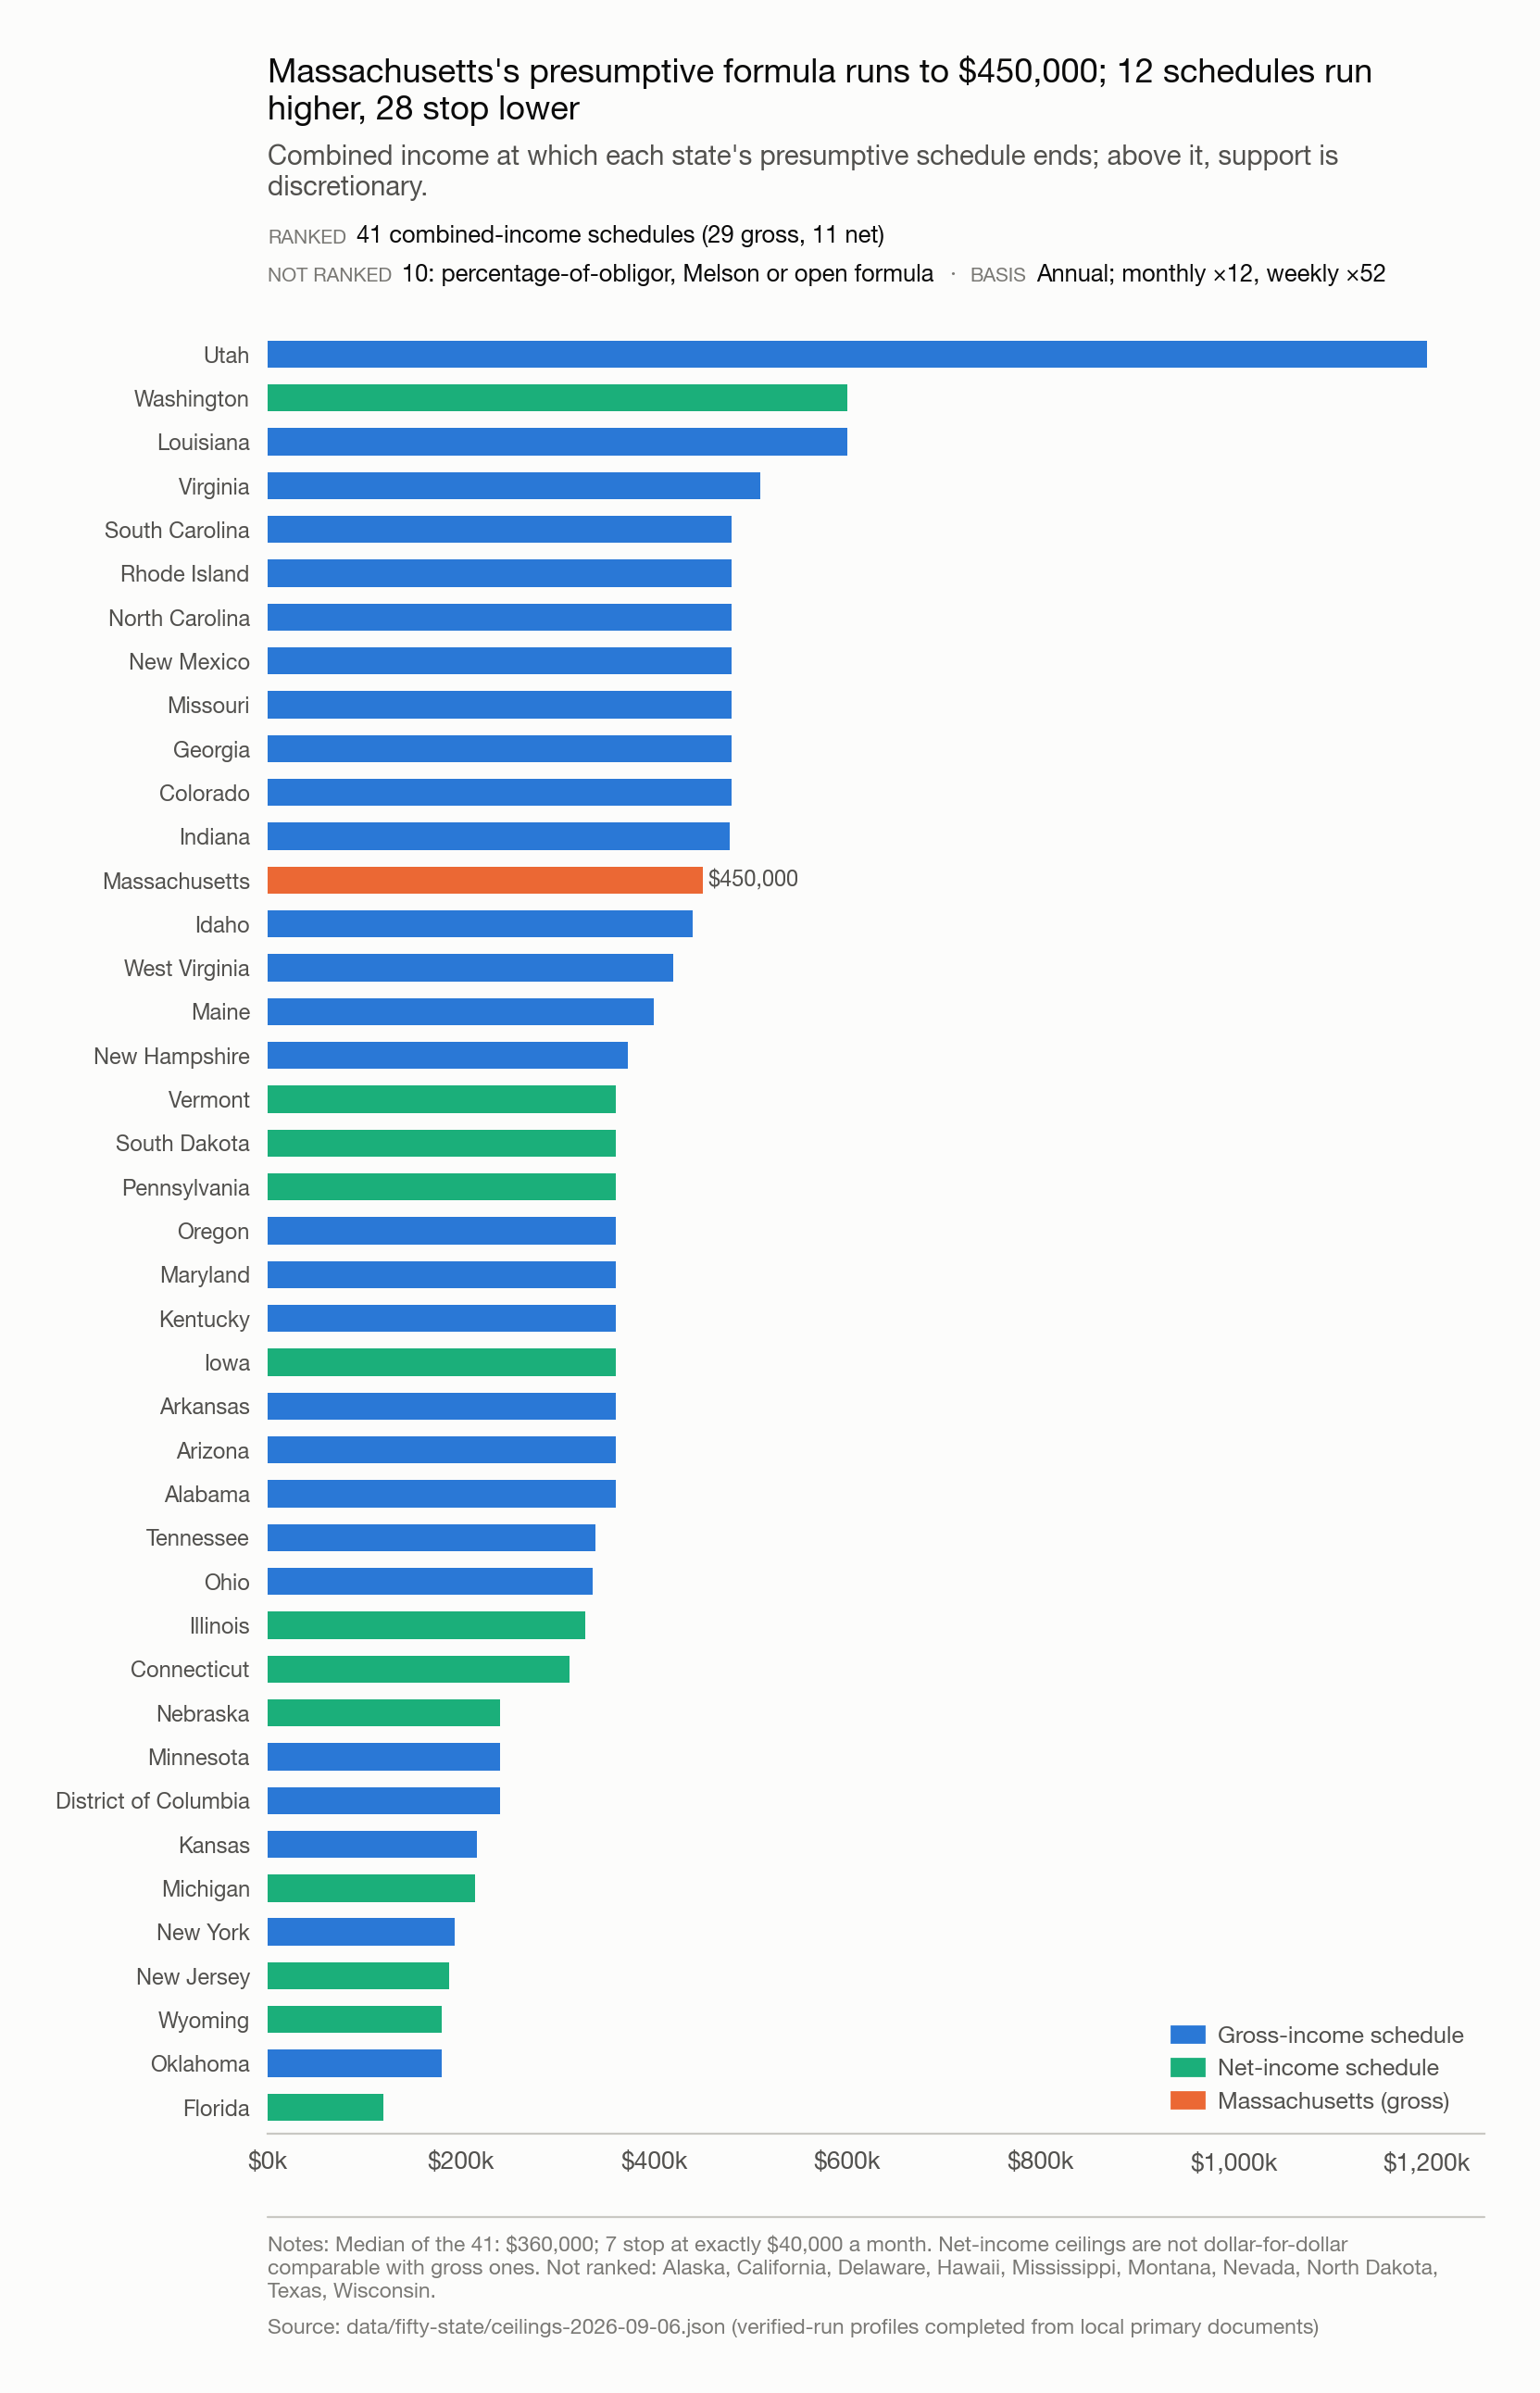
- Massachusetts’s presumptive formula runs to $450,000; 12 schedules run higher, 28 stop lower.
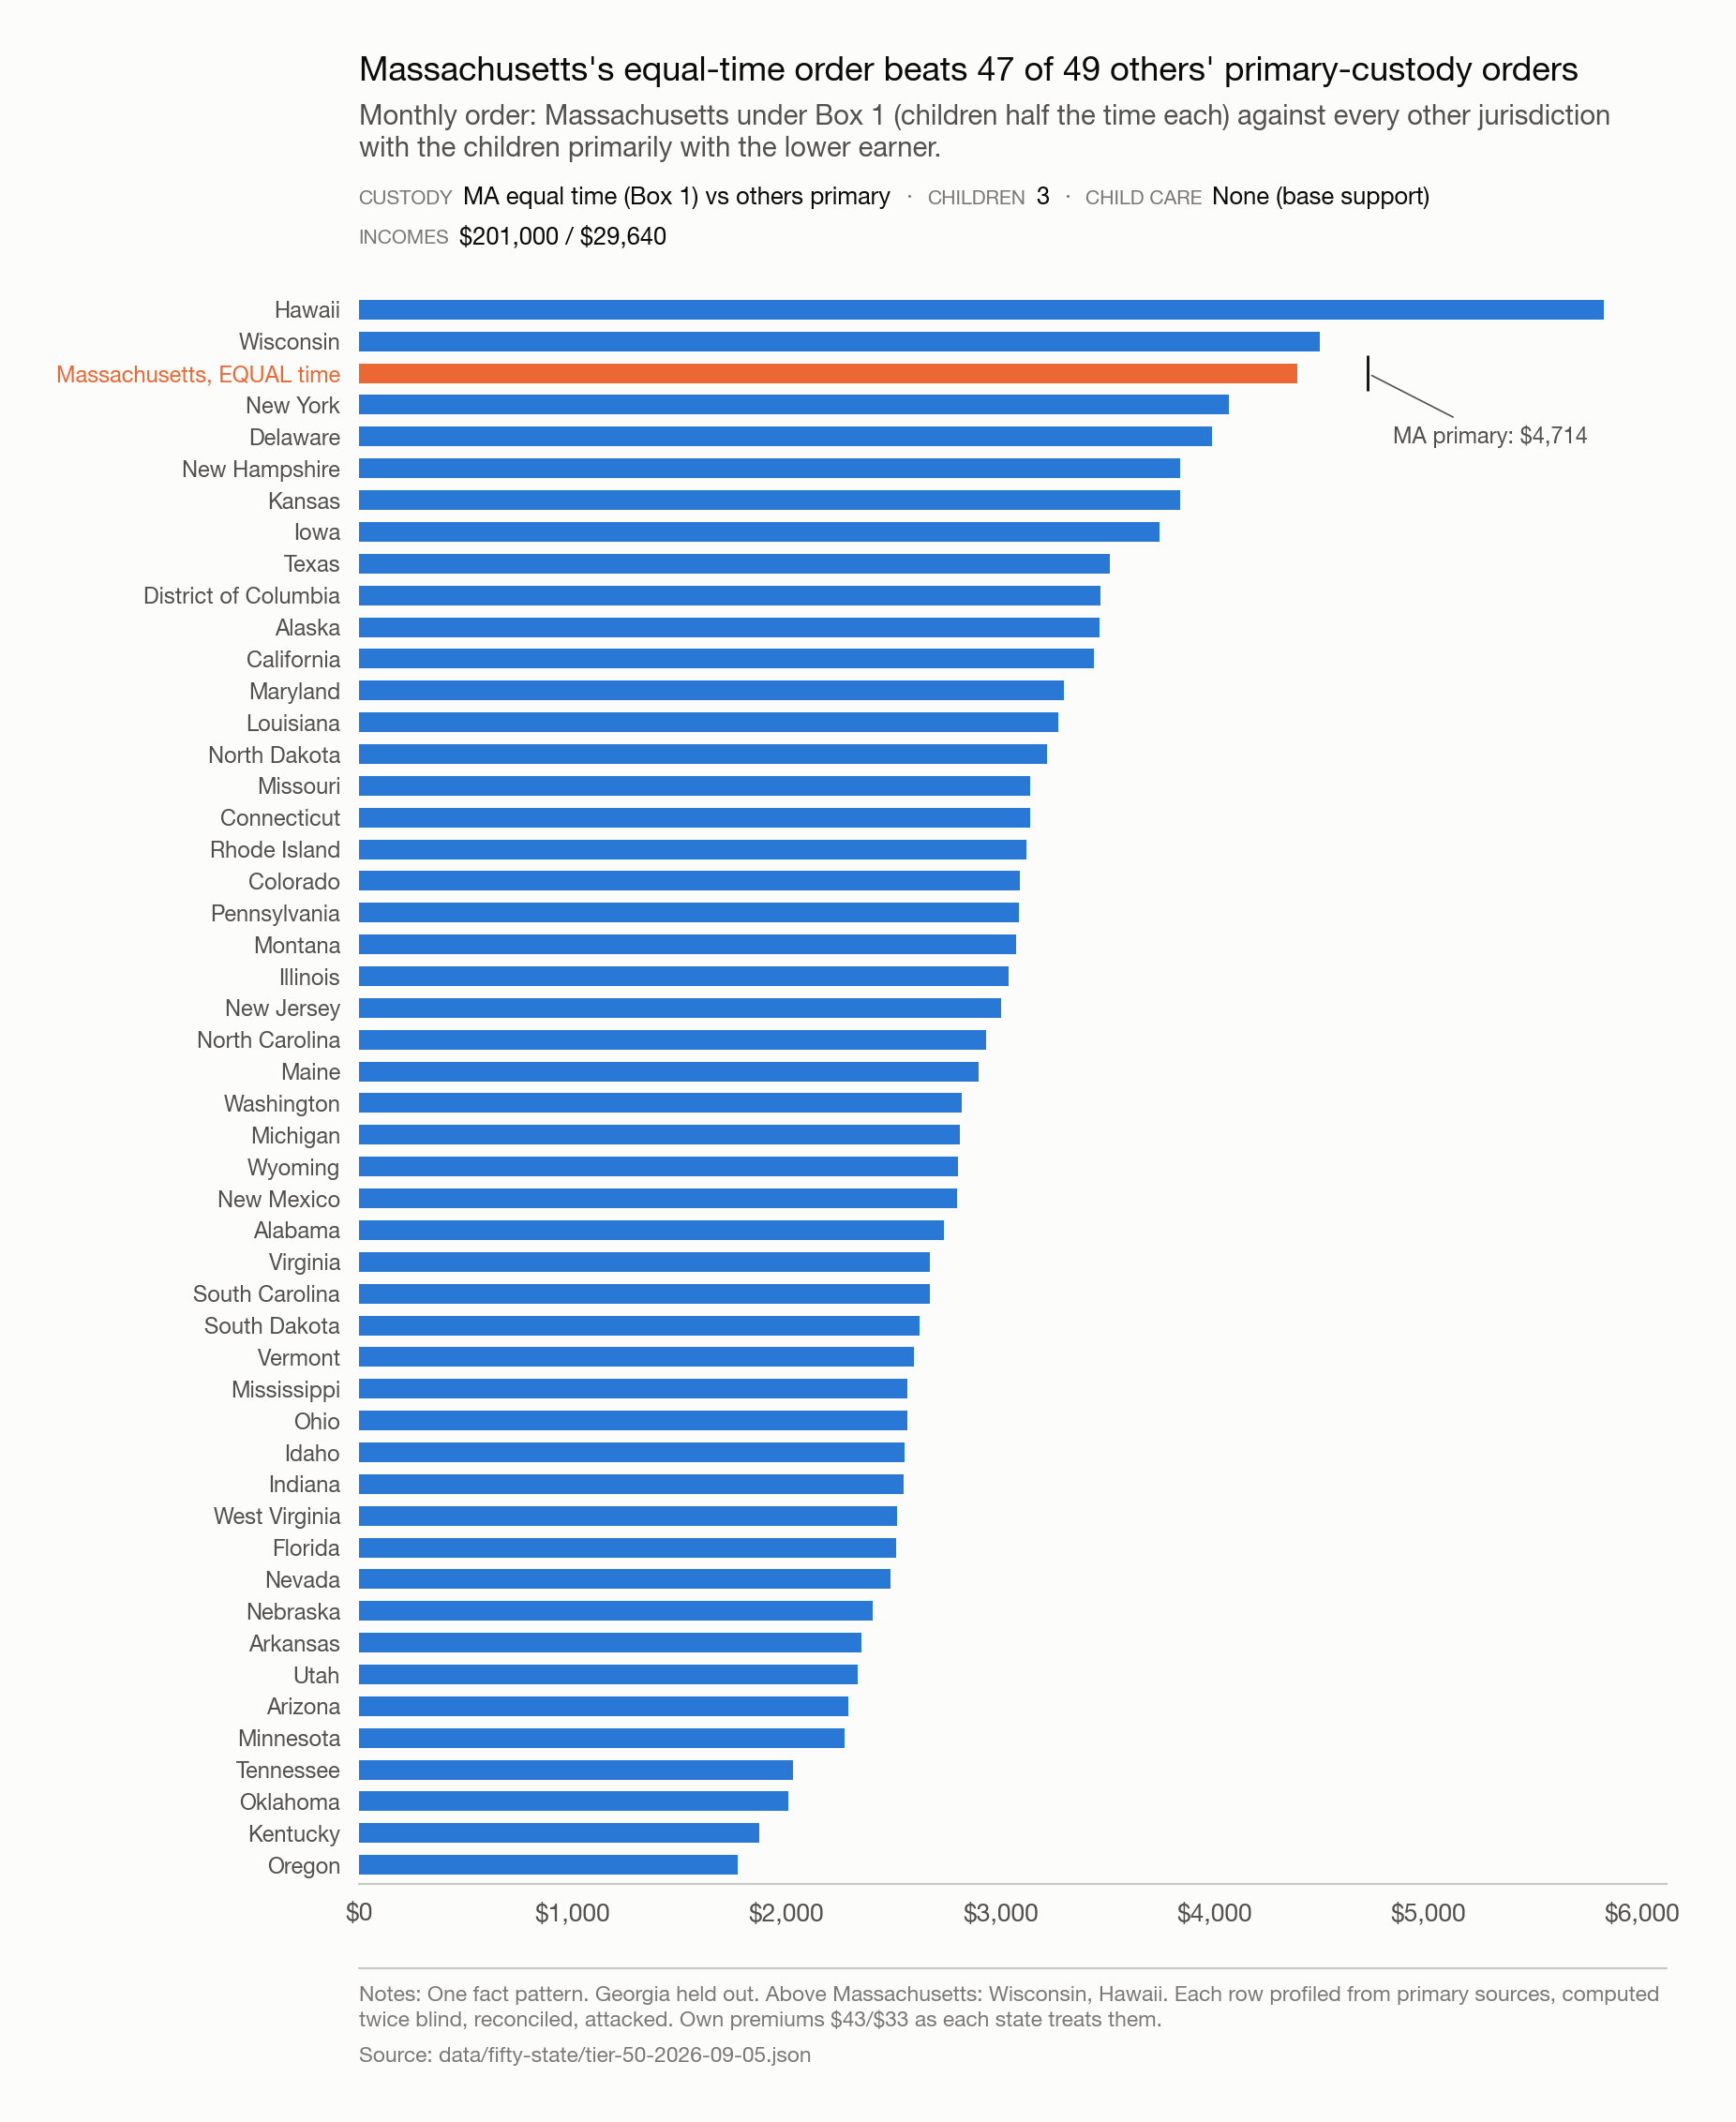
- At primary custody, only Wisconsin and Hawaii order more than Massachusetts does at equal time.
- Every place that costs more to live in than Massachusetts orders less at equal time.
- Massachusetts orders the most at equal time, and it is not the most expensive place to live.
- Five reviews have taken up gross versus net. None changed it.
The Massachusetts guidelines can set child support higher than federal law lets the state collect from wages
The federal government caps what may be withheld from a paycheck for child support at 60 percent of take-home pay, less for a payor supporting a second family, 15 U.S.C. § 1673(b)(2). With child care claimed, the Worksheet produces income pairs on a model grid whose order is above that limit. See the federal-law finding for the full argument.
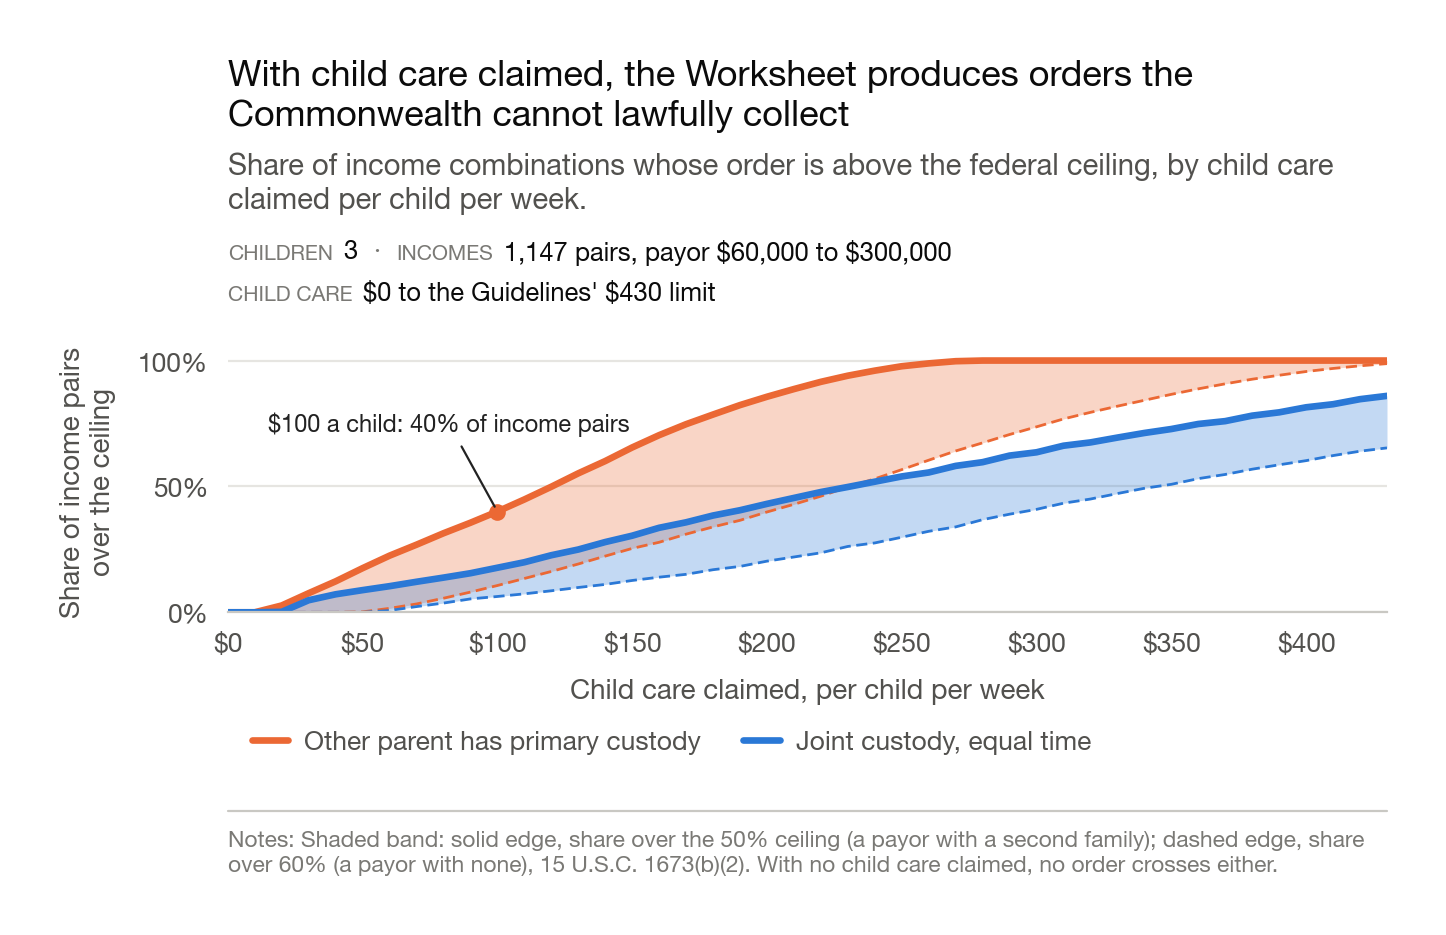
The Massachusetts guidelines can set child support higher than federal law lets the state collect from wages.
Share of income pairs whose order is above the federal limit on wage withholding, by child care claimed per child per week.
Three children. Federal limit on wage withholding, 15 U.S.C. § 1673(b)(2): 60 percent of take-home pay, less for a payor with a second family. At $100 a child, 10.6 percent of pairs cross it under primary custody. 40 percent have an order over half of take-home pay.
Source: model/ccpa_grid.py ·
data (CSV)
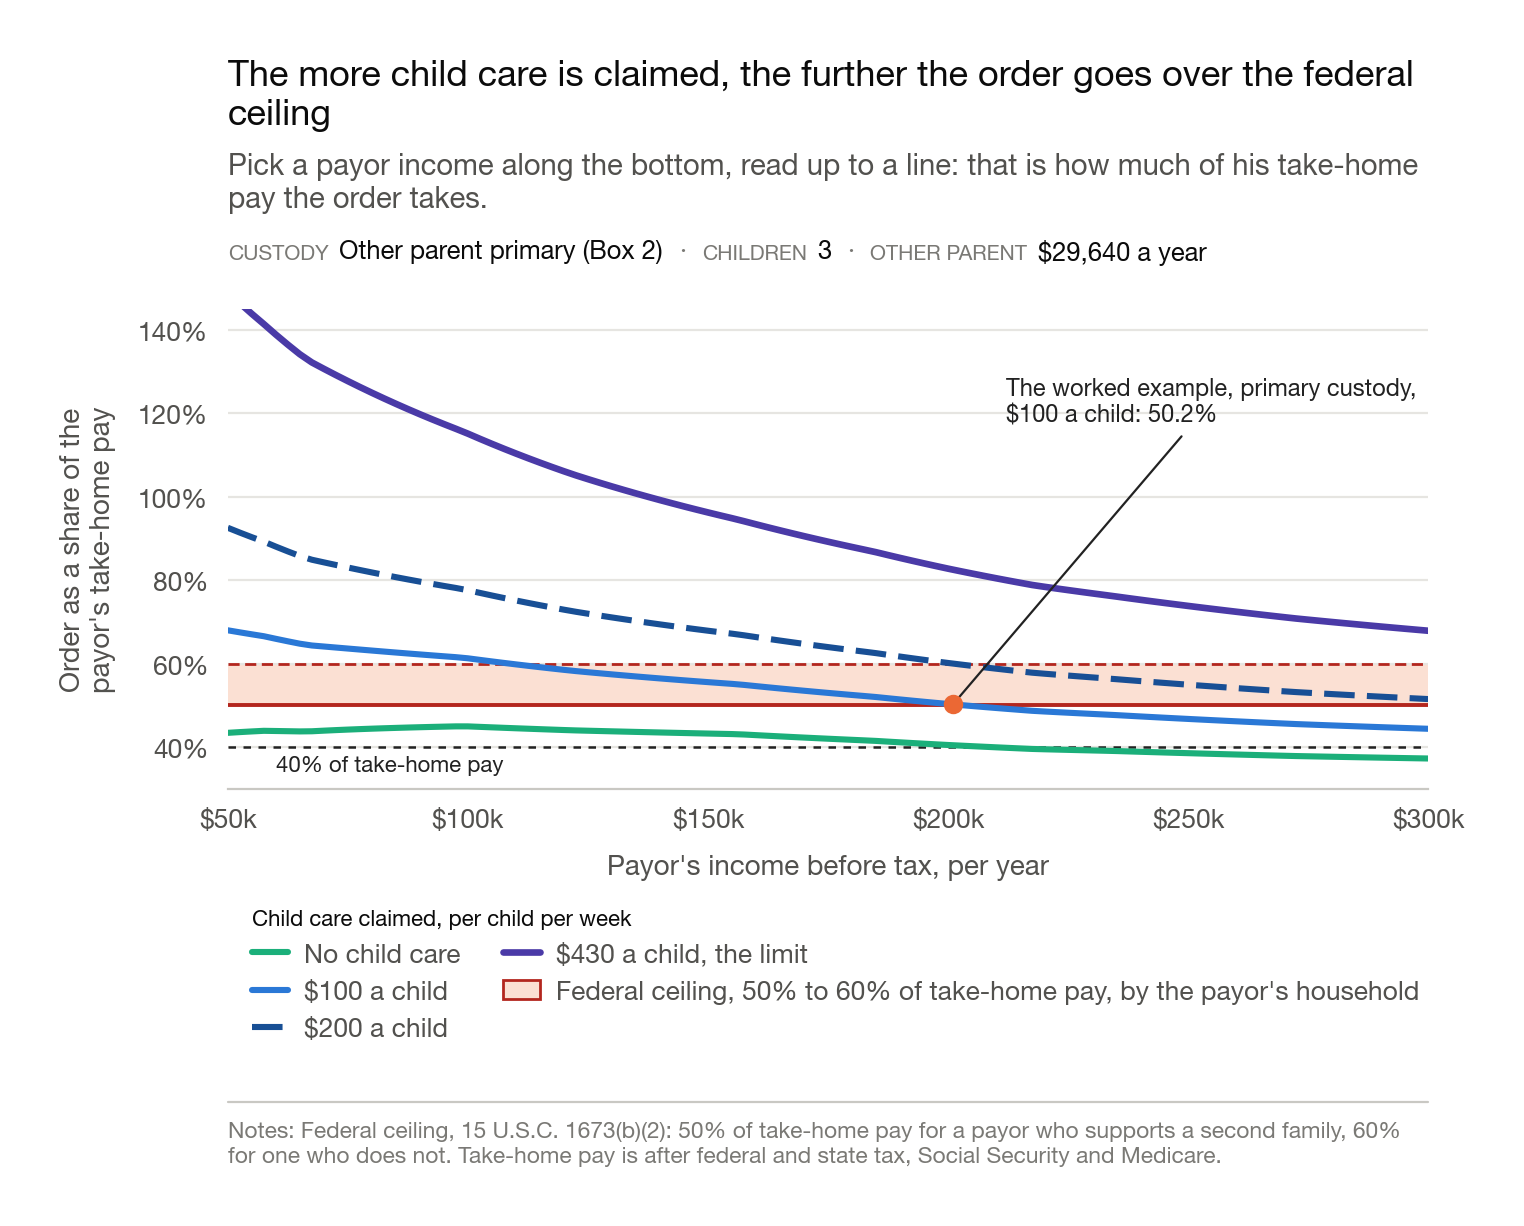
The more child care is claimed, the further the order goes over the federal limit on wage withholding
The order as a share of the payor's take-home pay, three children, the other parent primary, the other parent earning $29,640 a year.
The solid line is the federal limit on wage withholding, 60 percent of take-home pay, less for a payor with a second family. The dashed line marks half of take-home pay, a burden flag, not a legal limit. Take-home pay is after federal and state income tax, Social Security and Medicare.
Source: model/ccpa_grid.py ·
data (CSV)
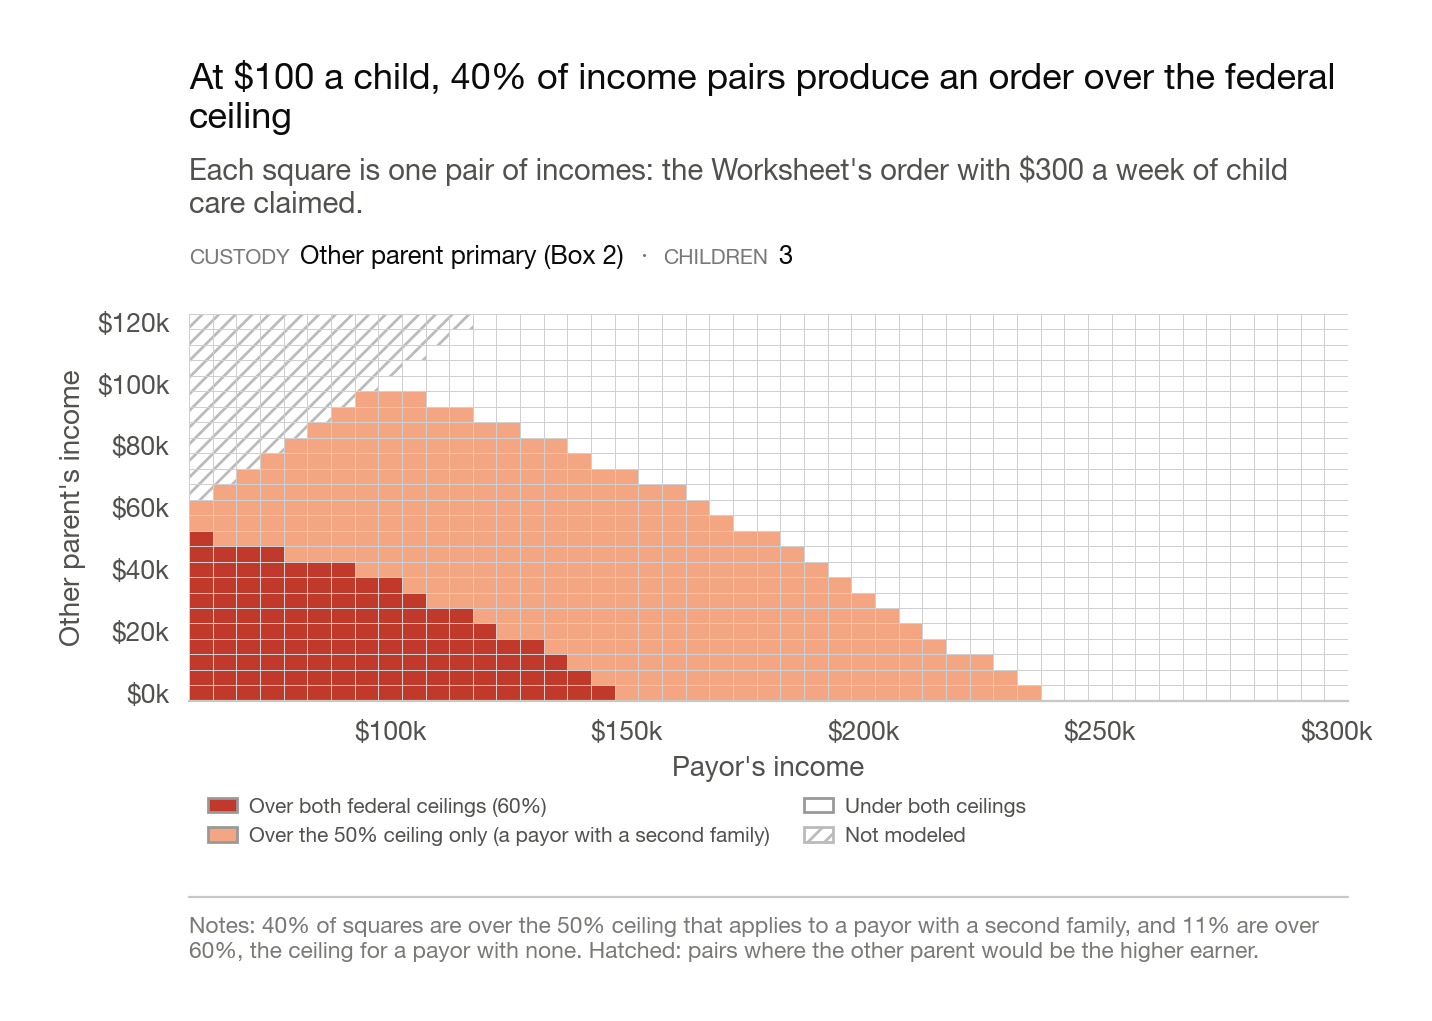
At $100 a child, 10.6% of income pairs produce an order over the federal limit on wage withholding.
Each square is one pair of incomes: the Worksheet's order with $300 a week of child care claimed for three children, primary custody.
Dark squares are over the federal limit on wage withholding, 60 percent of take-home pay. Light squares are over half of take-home pay but under that limit. Hatched squares are pairs where the other parent would be the higher earner. 10.6 percent of squares are dark. All of them also trip Massachusetts's own 40 percent hardship presumption, which helps only if the parent raises it and a judge agrees.
Source: model/ccpa_grid.py ·
data (CSV)
The recipient household comes out ahead more often as children are added, but per person the payor holds more almost everywhere
Verified against the form's own calculation scripts
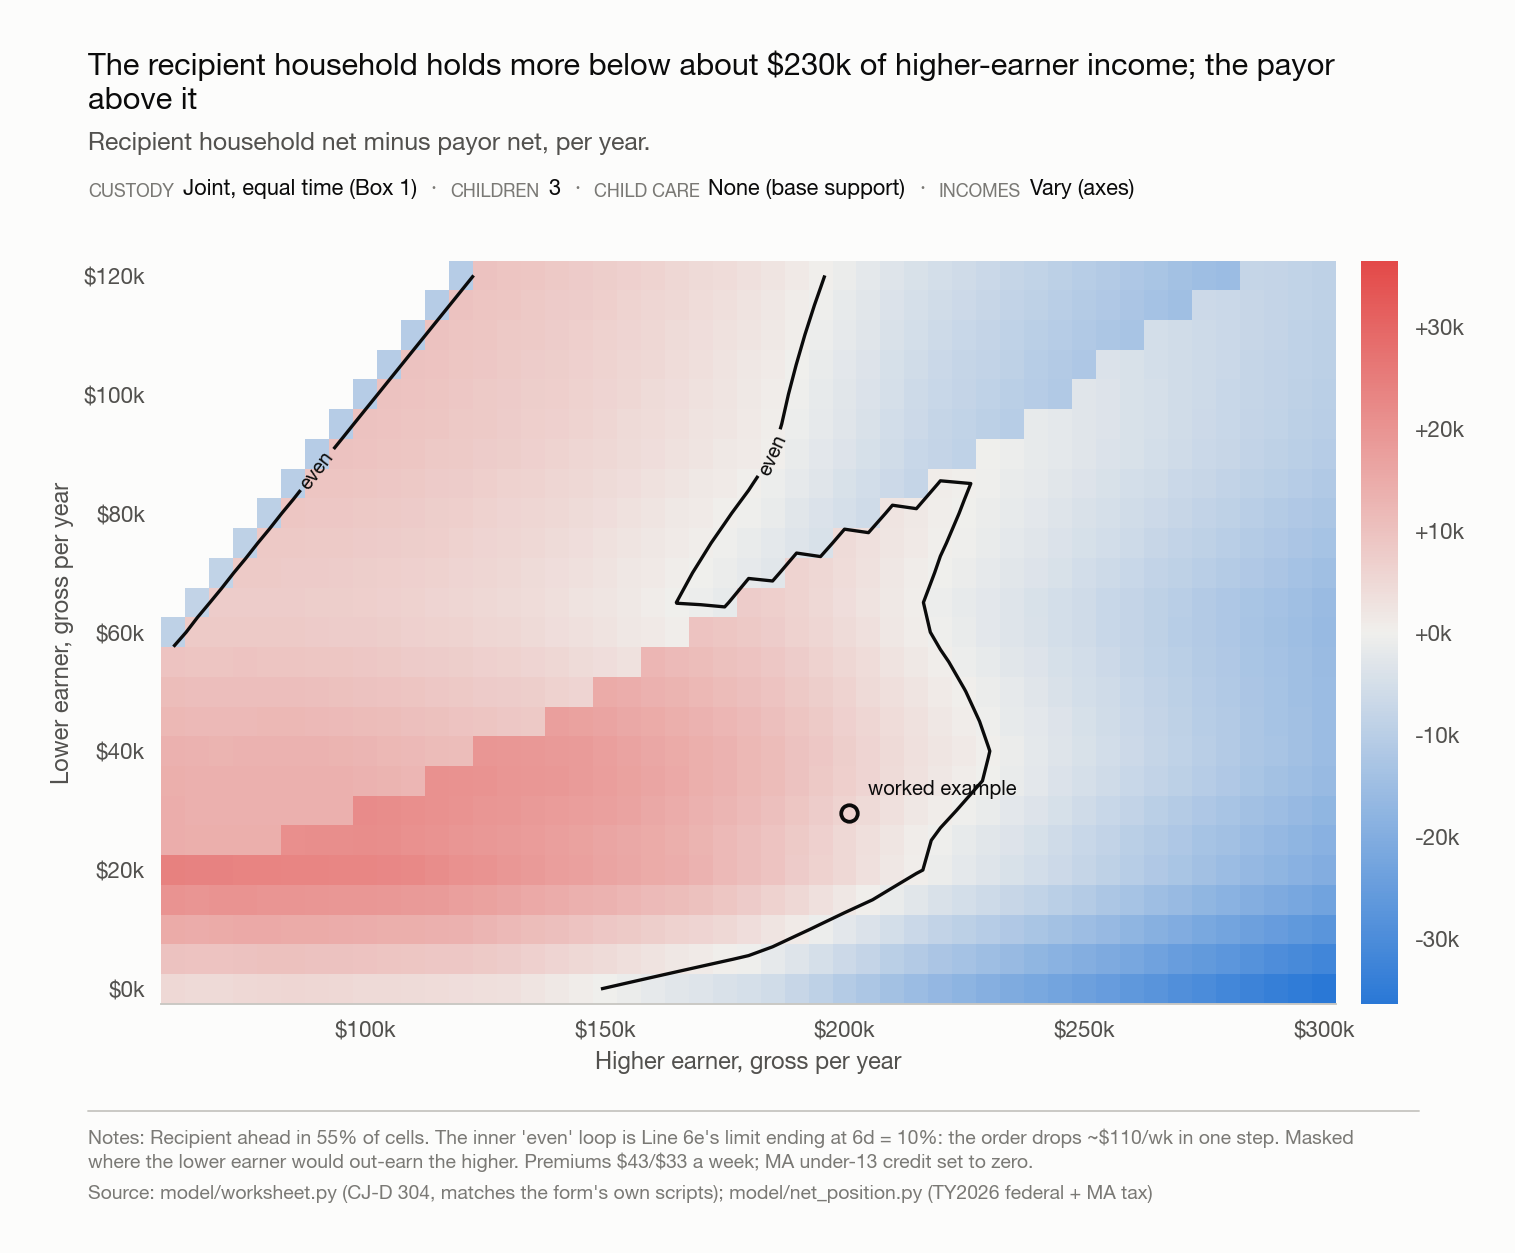
With three children, the recipient household holds more after the order in 10 percent of income combinations.
Recipient household net minus payor net, per year.
- Custody
- Joint, equal time (Box 1)
- Children
- 3
- Child care
- None (base support)
- Incomes
- Vary (axes)
Of the 9.9 percent (114 of 1,147) of the grid where the recipient household is ahead, 75.4 percent (86 of 114) sits below $150,000 of higher-earner income, and none above $175,000. The closed contour inside the red region is Line 6e's limitation, which stops binding once the payor's Line 6d crosses 10 percent; the order then drops about $110 a week in one step. Per person the payor still leads almost everywhere (E02). Masked where the lower earner would out-earn the higher. Premiums $43/$33 a week; MA under-13 credit set to zero; no refundable tax credits counted.
Source: model/charts/fig1_heatmaps.py; model/worksheet.py; model/net_position.py ·
data (CSV)
Verified against the form's own calculation scripts
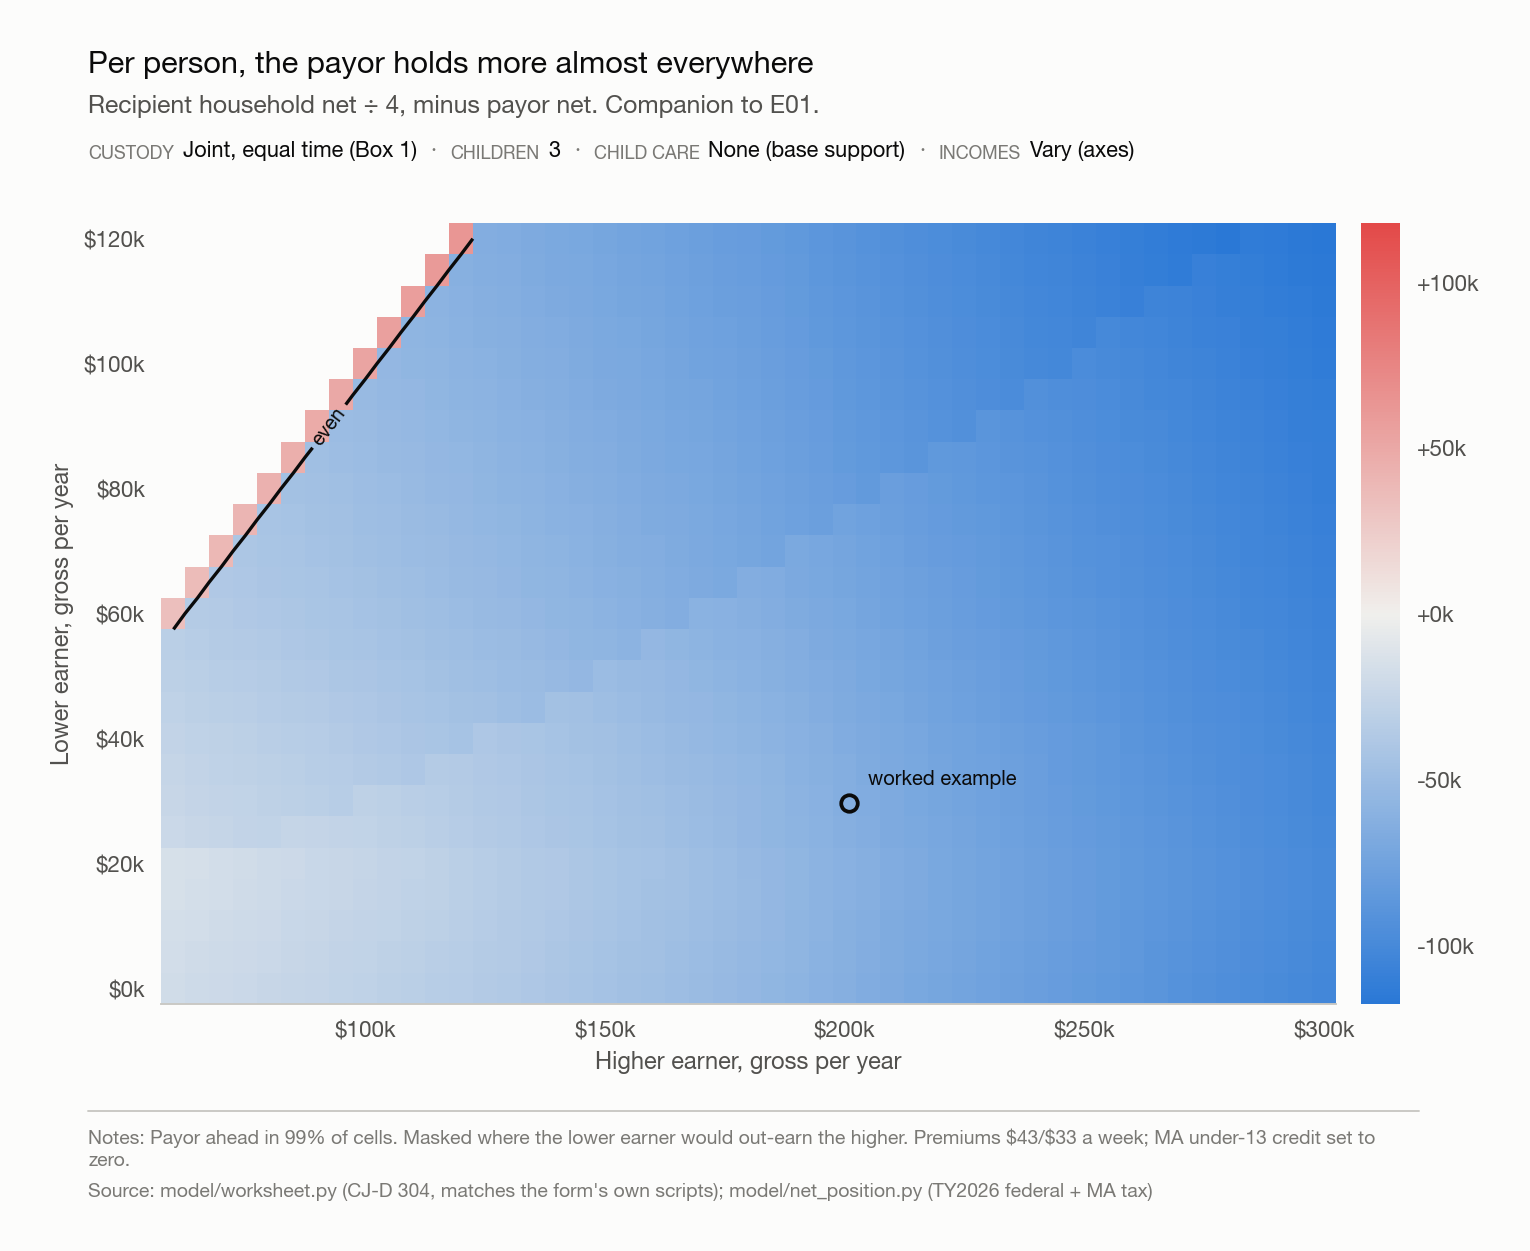
Per person, the payor holds more almost everywhere.
Recipient household net ÷ 4, minus payor net. Companion to E01.
- Custody
- Joint, equal time (Box 1)
- Children
- 3
- Child care
- None (base support)
- Incomes
- Vary (axes)
The payor is ahead per person in 98.9 percent (1,134 of 1,147) of the grid. This pairs with E01, since per person is the comparison a reader will raise first. Masked where the lower earner would out-earn the higher. Premiums $43/$33 a week; MA under-13 credit set to zero.
Source: model/charts/fig1_heatmaps.py; model/worksheet.py; model/net_position.py ·
data (CSV)
Verified against the form's own calculation scripts
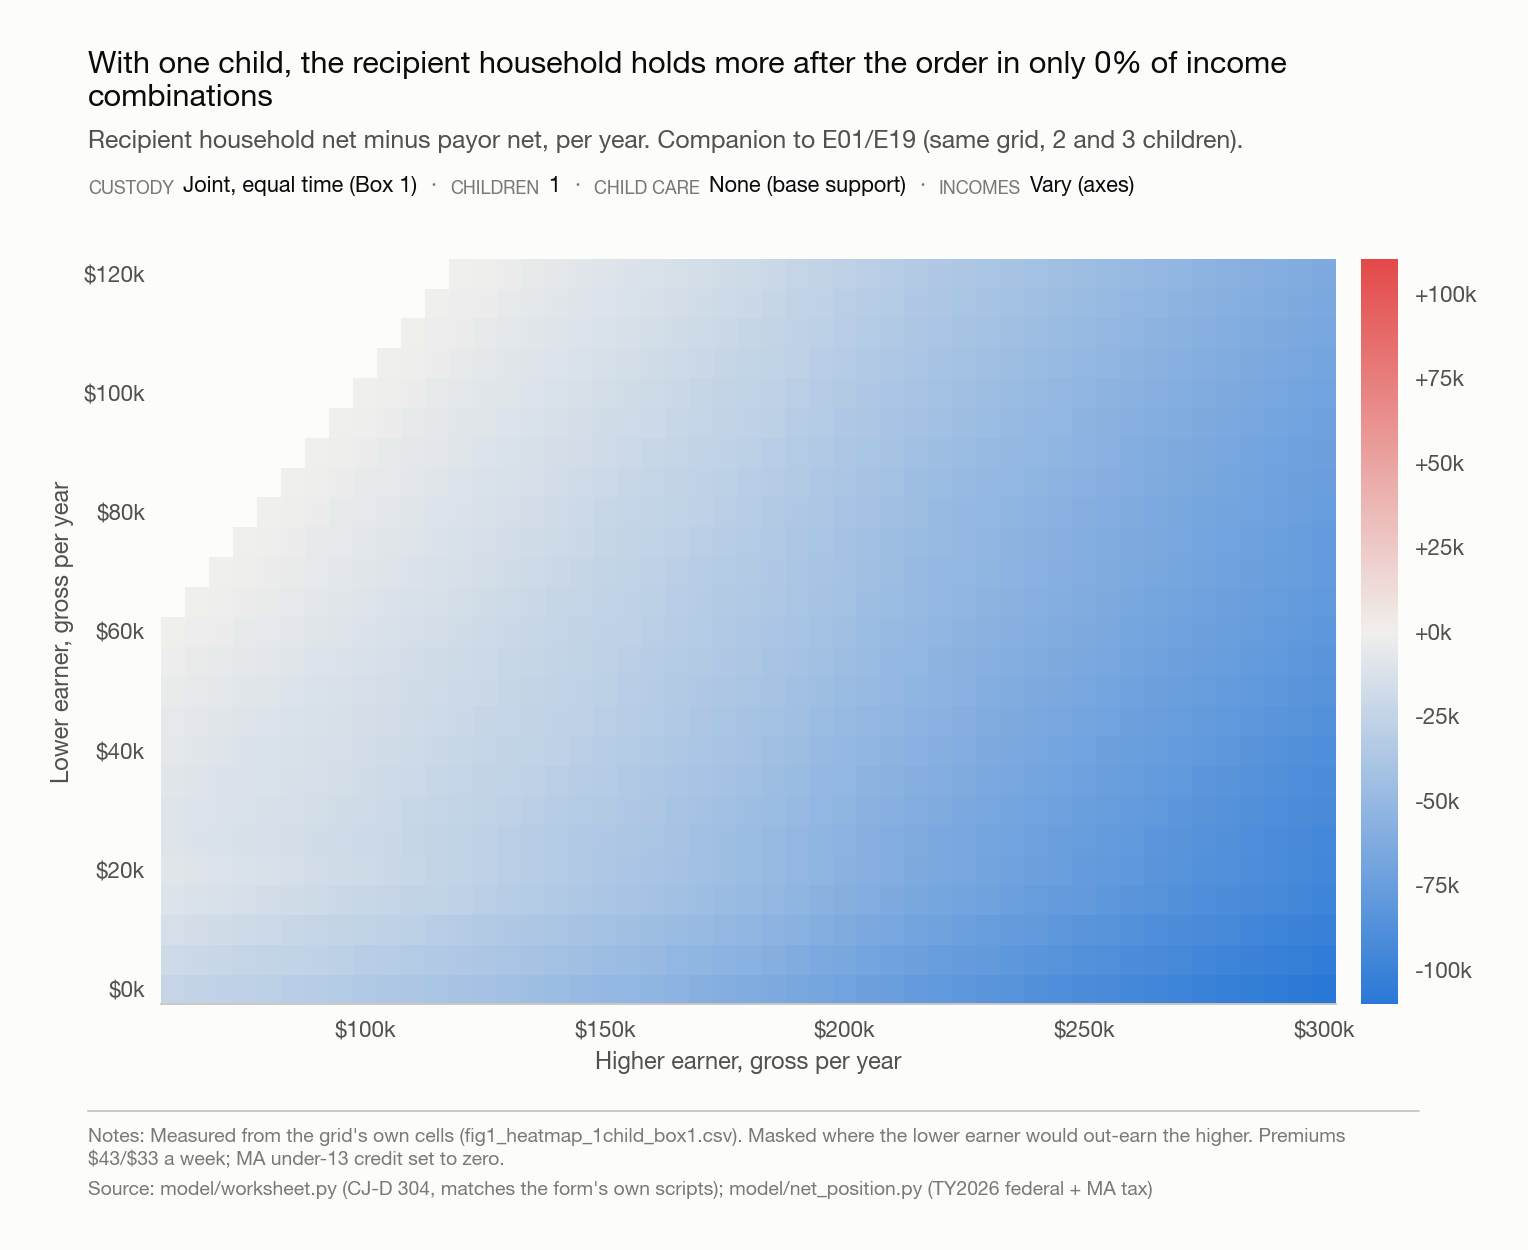
With one child, the recipient household holds more after the order in no income combinations.
Recipient household net minus payor net, per year. Companion to E01/E19 (same grid, two and three children).
- Custody
- Joint, equal time (Box 1)
- Children
- 1
- Child care
- None (base support)
- Incomes
- Vary (axes)
Same grid and colour scale as E01, one child instead of three. With E19, this shows the number of children, not any one family's facts, decides which household comes out ahead. Per person the payor leads far more broadly still (E02 holds at all three child counts). Masked where the lower earner would out-earn the higher. Premiums $43/$33 a week; MA under-13 credit set to zero.
Source: model/charts/fig1_heatmaps.py; model/worksheet.py; model/net_position.py ·
data (CSV)
Verified against the form's own calculation scripts
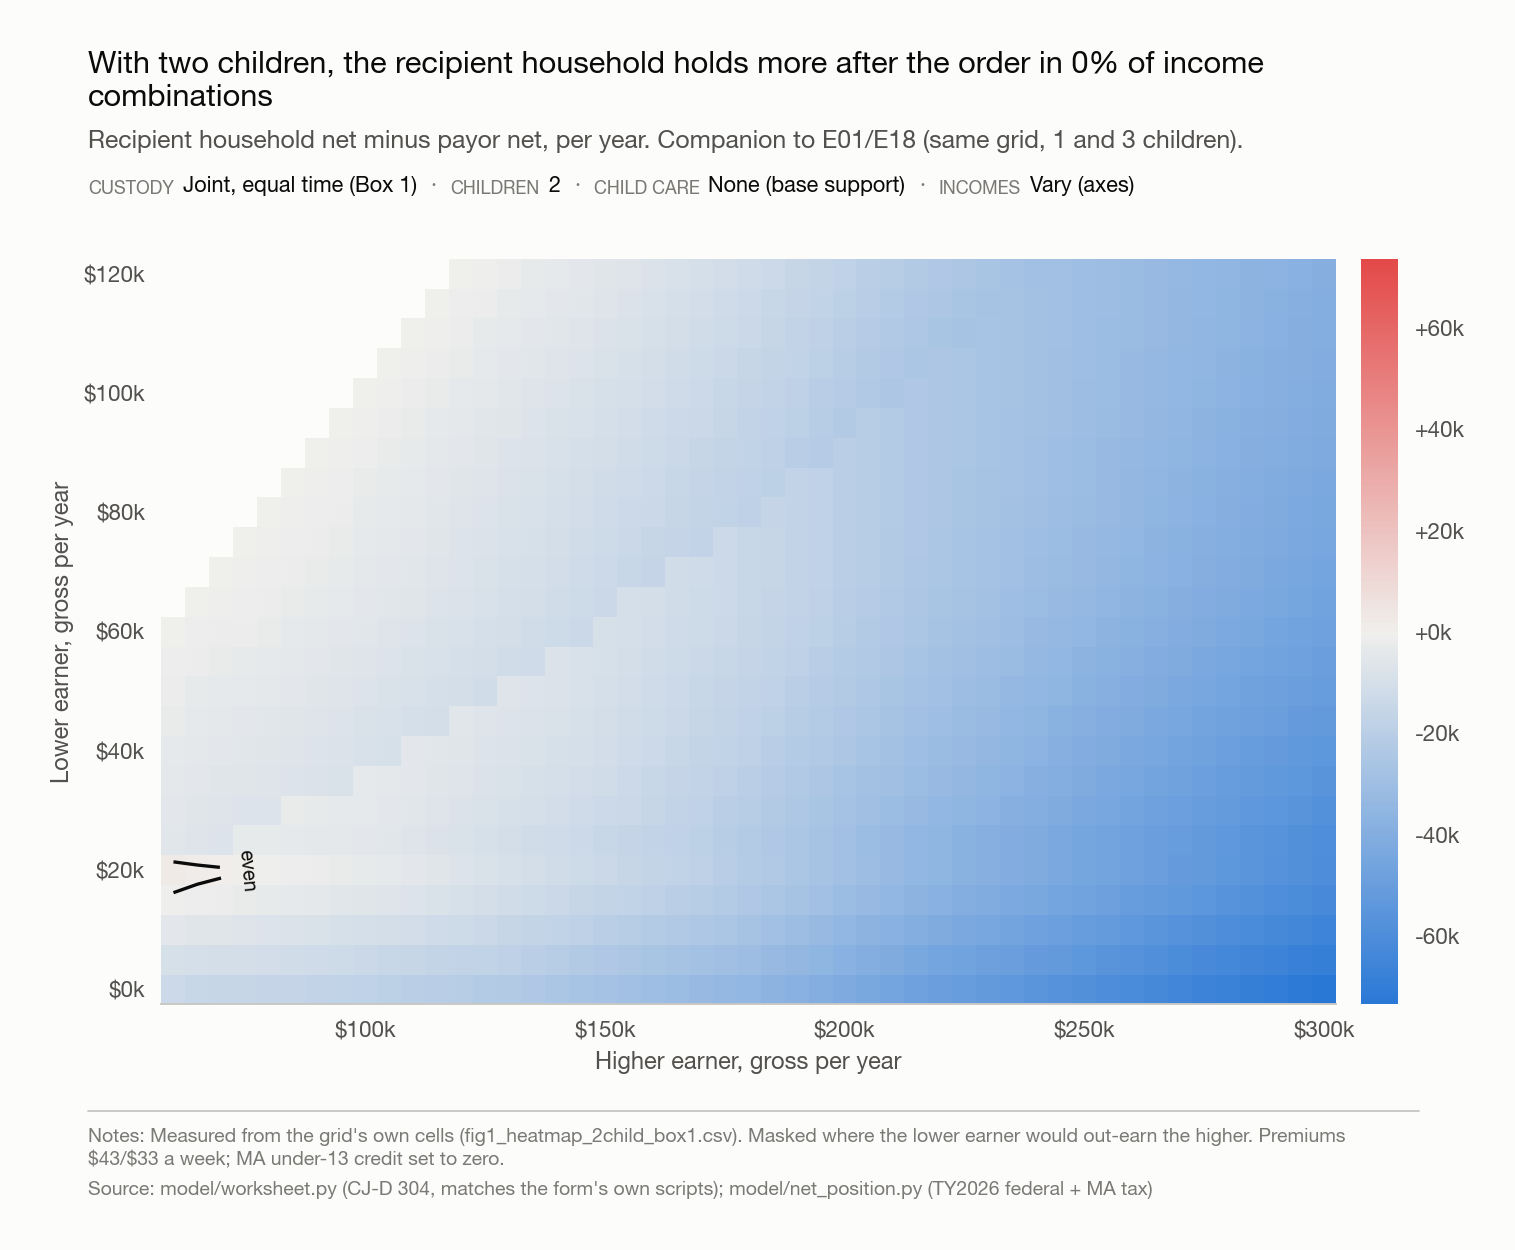
With two children, the recipient household holds more after the order in 4 of 1,147 income combinations (0.3 percent).
Recipient household net minus payor net, per year. Companion to E01/E18 (same grid, one and three children).
- Custody
- Joint, equal time (Box 1)
- Children
- 2
- Child care
- None (base support)
- Incomes
- Vary (axes)
Same grid and colour scale as E01 and E18. The share is a genuine zero at one child, rises to 4 of 1,147 cells at two (all at a lower earner of $20,000, higher earner $60,000 to $75,000), and to 10 percent at three, a child-count effect, not an artifact of one income pair. Masked where the lower earner would out-earn the higher. Premiums $43/$33 a week; MA under-13 credit set to zero; no refundable tax credits counted.
Source: model/charts/fig1_heatmaps.py; model/worksheet.py; model/net_position.py ·
data (CSV)
Verified against the form's own calculation scripts
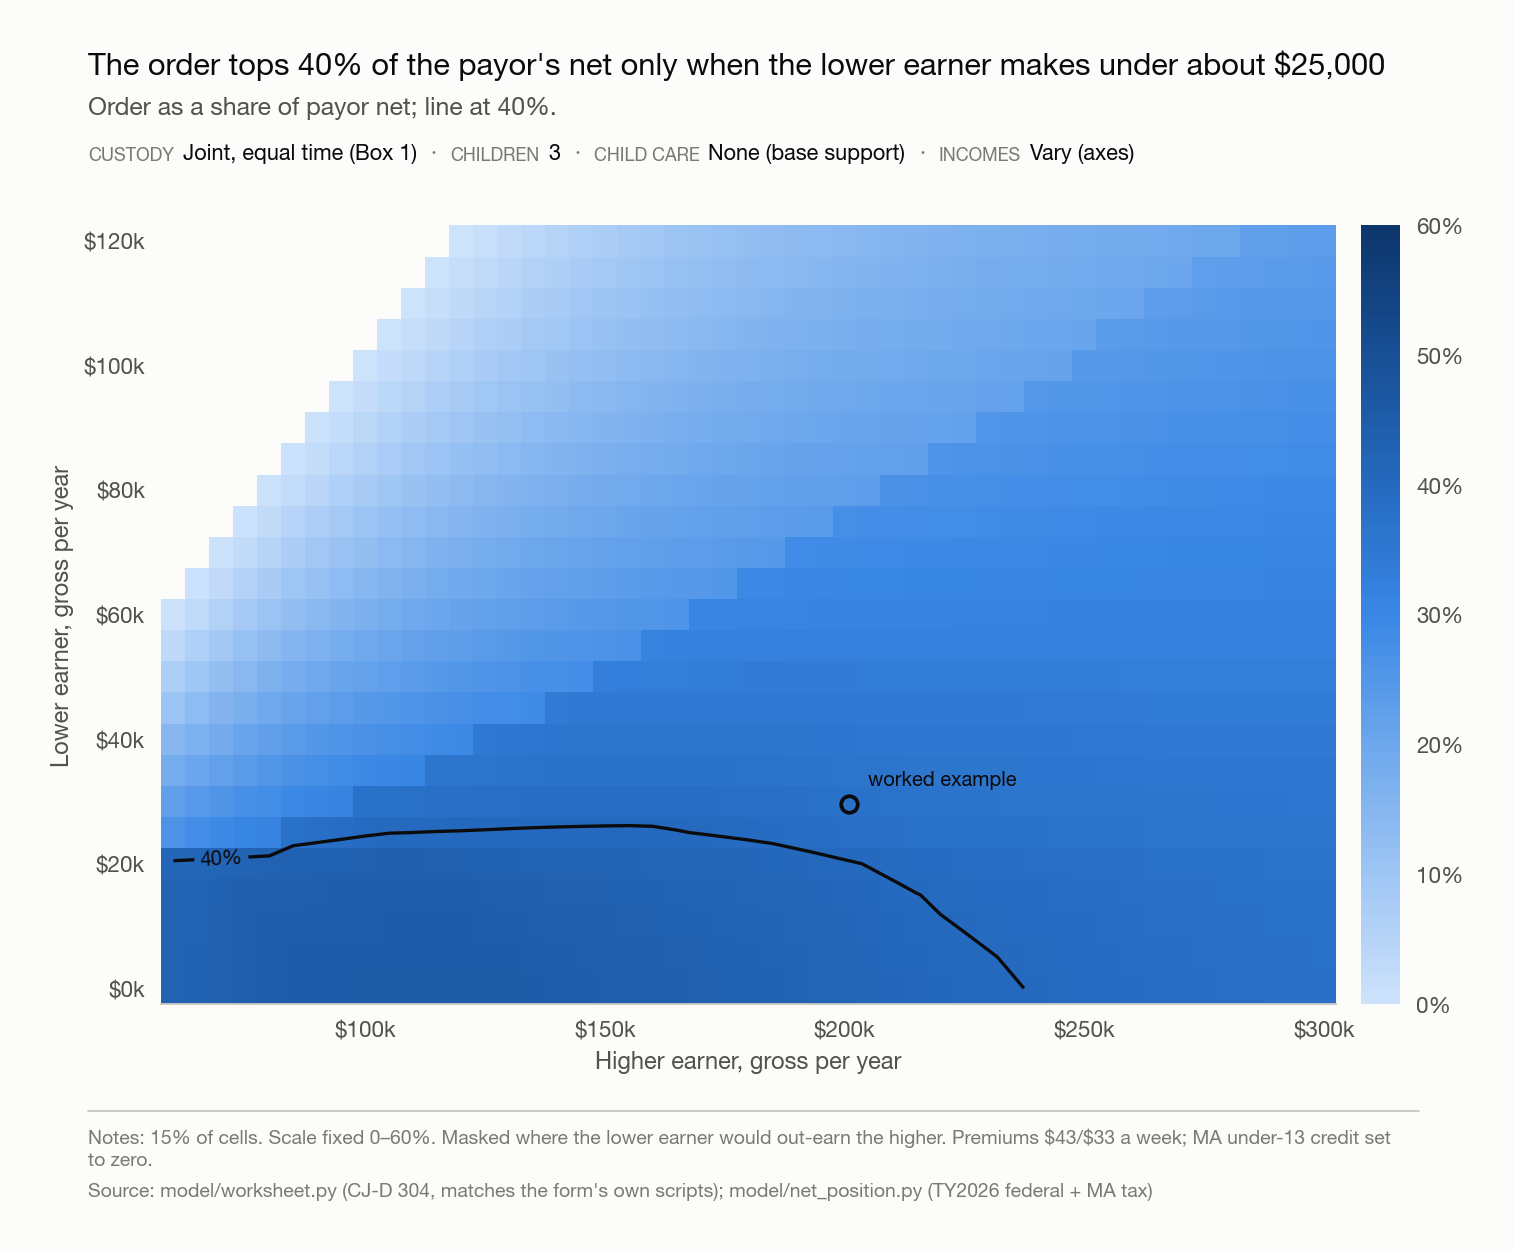
The order exceeds 40 percent of the payor's net income only where the lower earner makes about $20,000 or less.
Order as a share of payor net; line at 40%.
- Custody
- Joint, equal time (Box 1)
- Children
- 3
- Child care
- None (base support)
- Incomes
- Vary (axes)
The 40 percent contour sits near $20,000 of lower-earner income up to about $205,000 of higher-earner income; above that, the order never reaches 40 percent of net on the grid (15.4 percent of cells, 177 of 1,147). Scale fixed 0 to 60 percent. Section IV.C's hardship presumption is written for the region under this contour; E05 shows what the Worksheet reports there. Masked where the lower earner would out-earn the higher. Premiums $43/$33 a week; MA under-13 credit set to zero.
Source: model/charts/fig1_heatmaps.py; model/worksheet.py; model/net_position.py ·
data (CSV)
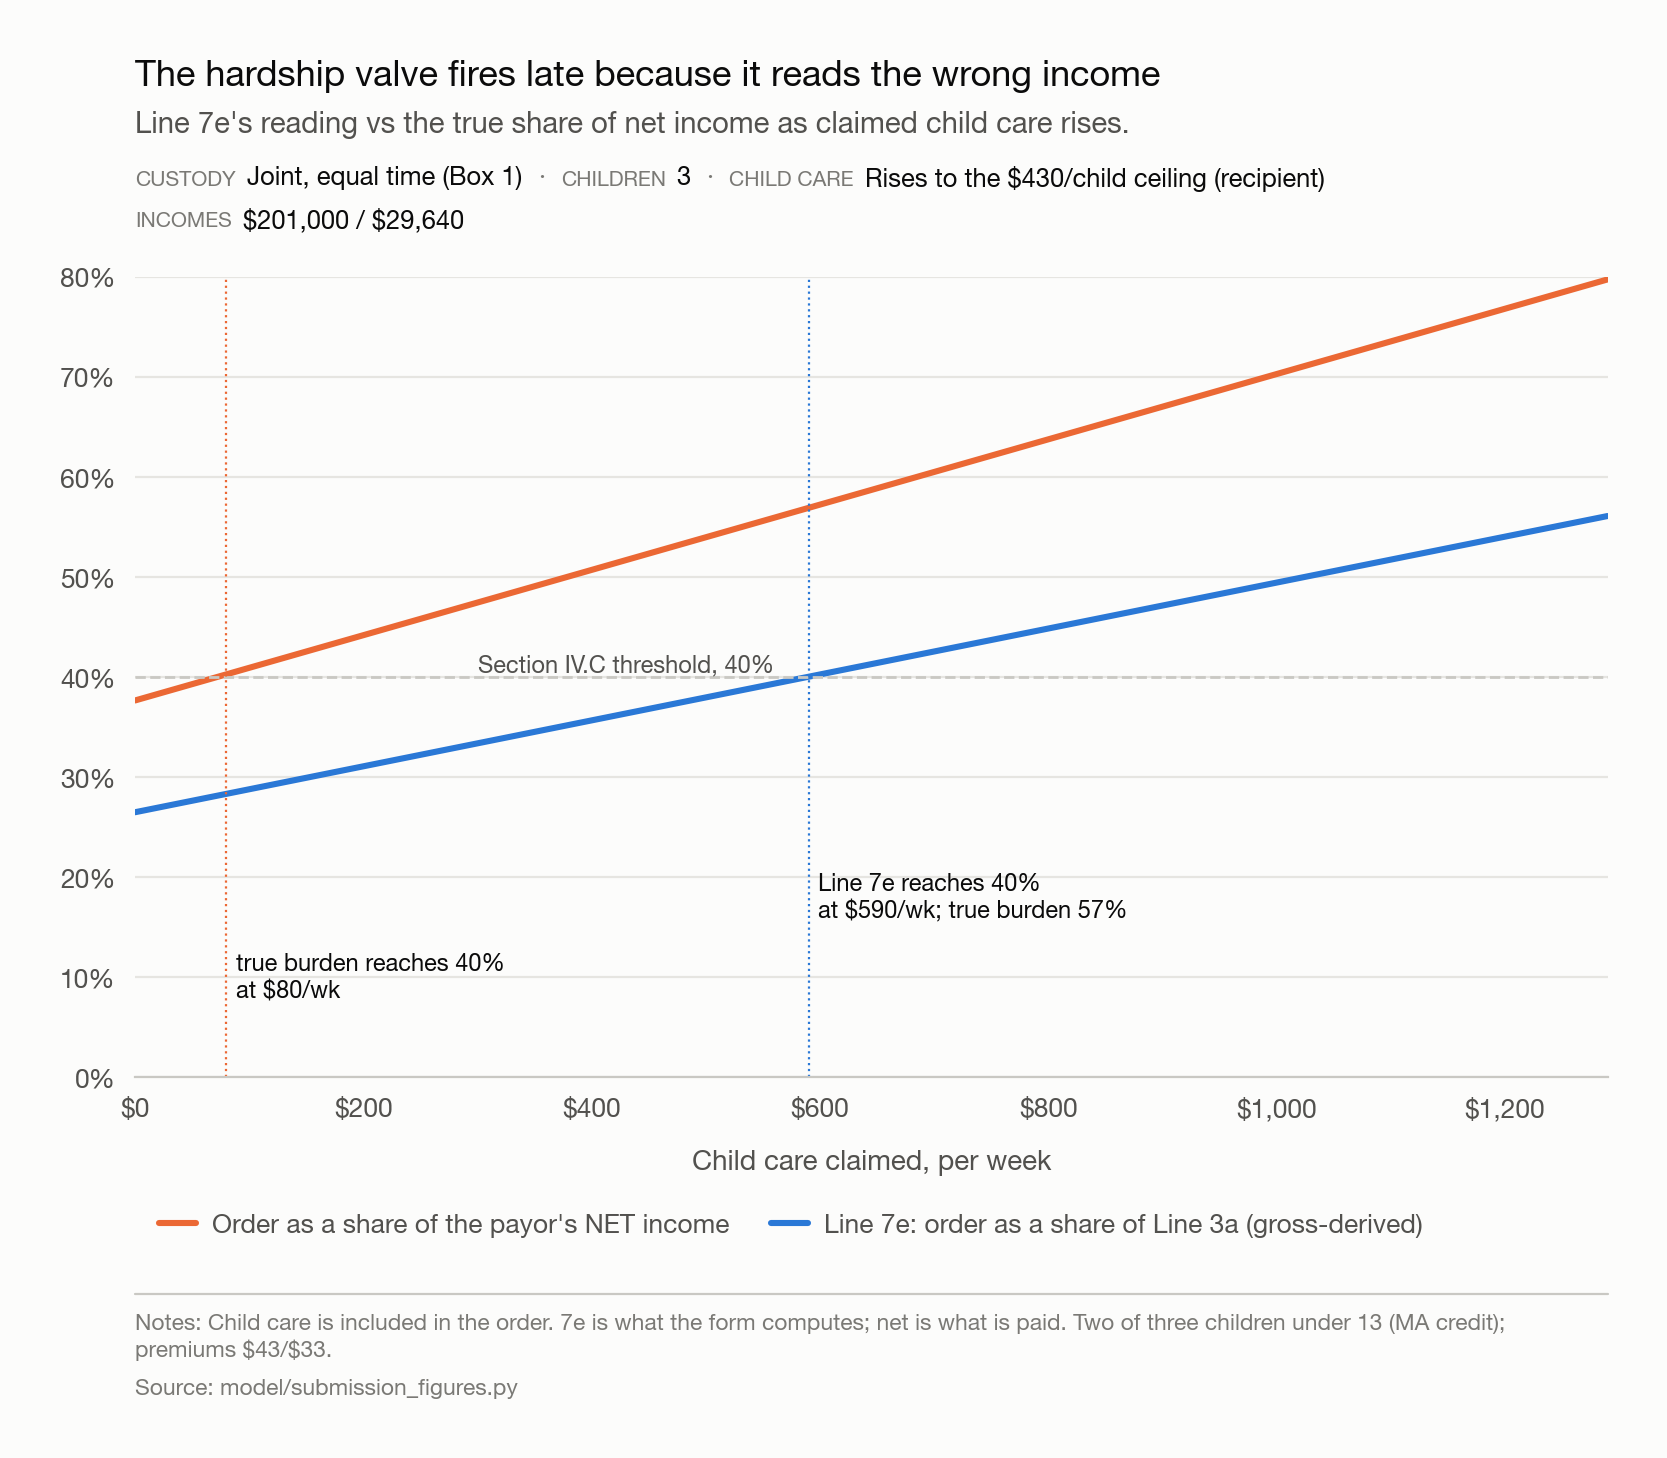
The hardship test reads the wrong income, and a raise is worth less than it looks
Verified against the form's own calculation scripts
The hardship test fires late because it reads the wrong income.
Line 7e's reading vs the true share of net income as claimed child care rises.
- Custody
- Joint, equal time (Box 1)
- Children
- 3
- Child care
- Rises to the $430/child ceiling (recipient)
- Incomes
- $201,000 / $29,640
As claimed child care rises, the true burden passes 40 percent of net at $130 a week; Line 7e reports 40 percent only at $590 a week, by which point the true burden is 55 percent. Nothing on the form flags the gap. Child care is included in the order. Two of three children under 13 (MA credit); premiums $43/$33.
Source: model/charts/fig6_valve.py; model/submission_figures.py ·
data (CSV)
Verified against the form's own calculation scripts
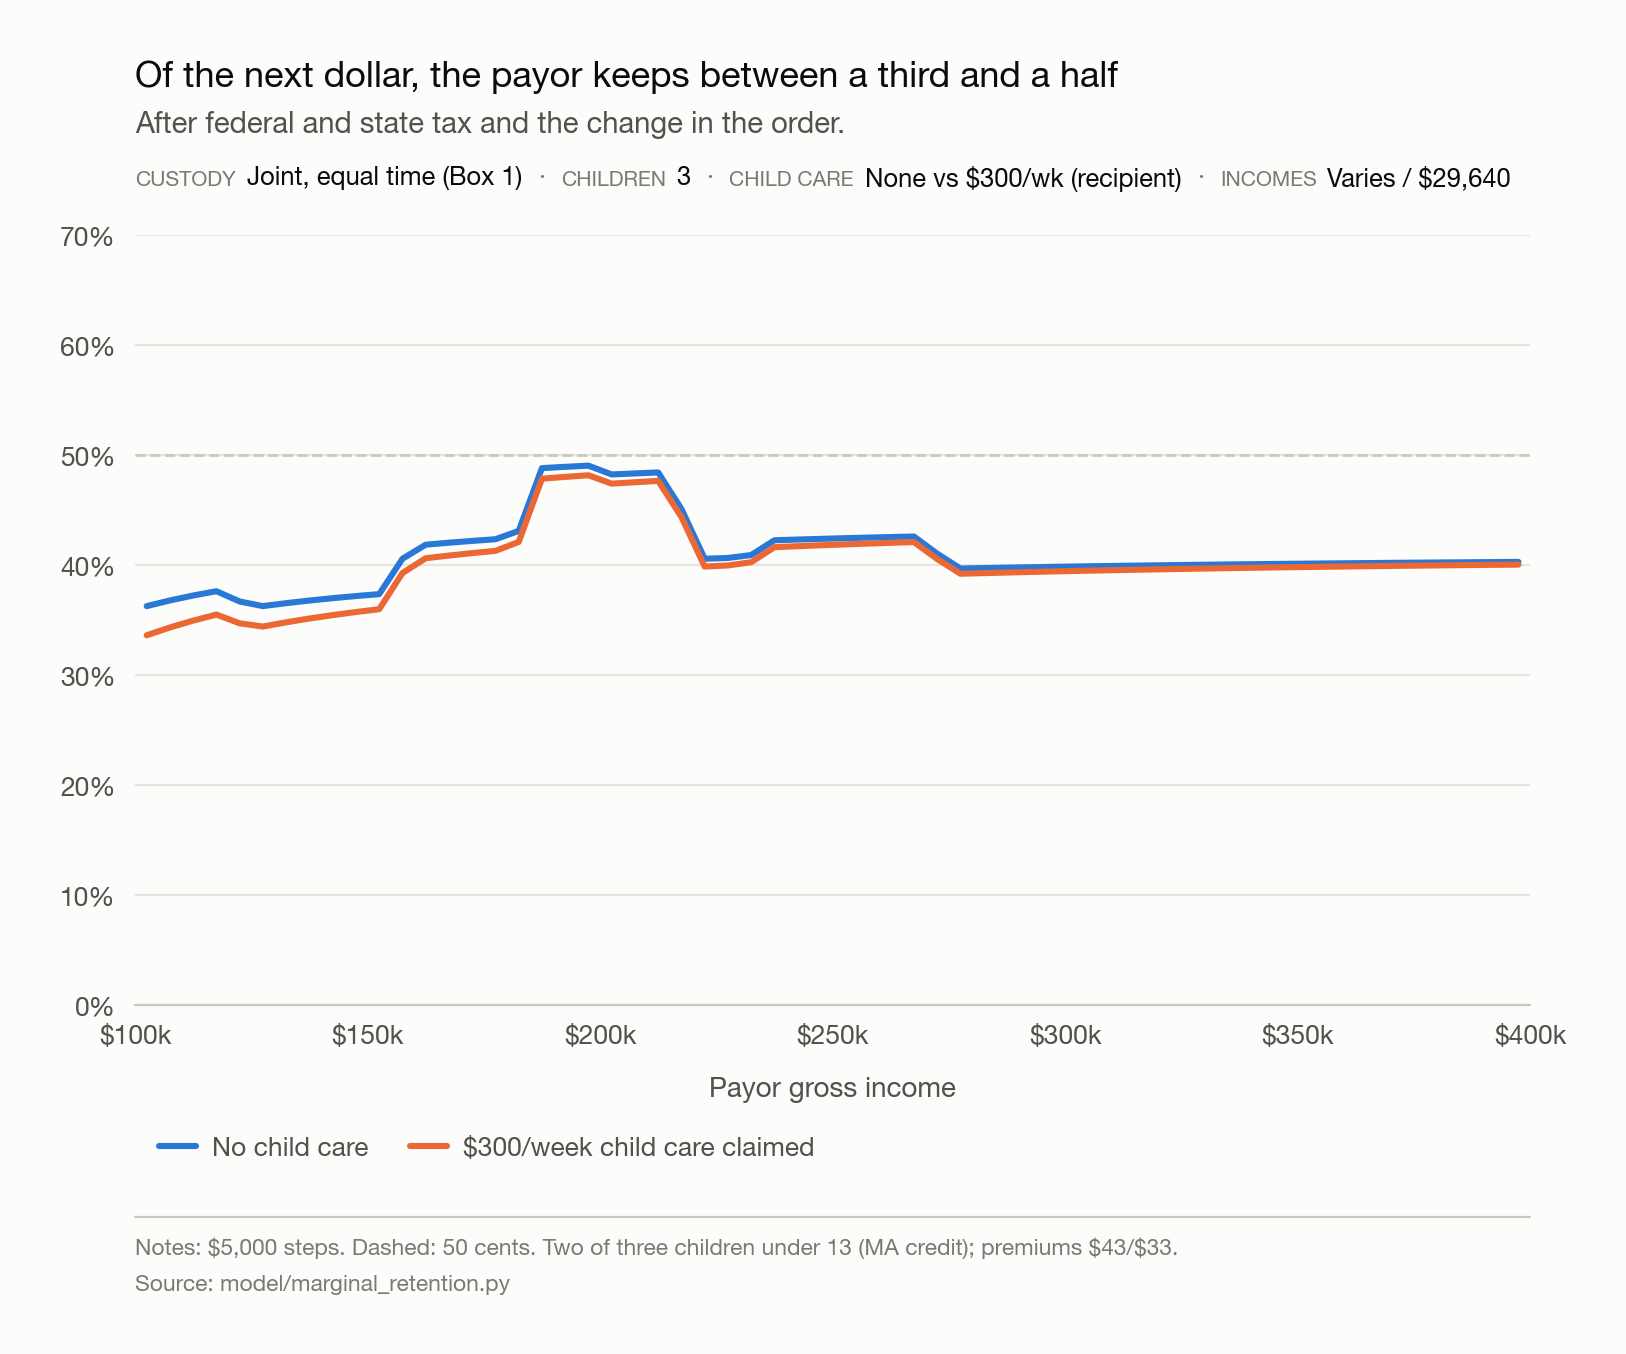
Of the payor's next dollar, the payor keeps between a third and a half.
Marginal retention after federal and state tax and the change in the order.
- Custody
- Joint, equal time (Box 1)
- Children
- 3
- Child care
- None vs $300/wk (recipient)
- Incomes
- Varies / $29,640
The order's marginal take runs near 20 percent, above Table A's 10 percent top bracket, because the child-count multiplier and the rising income share both scale with the payor's income. $5,000 steps. Dashed line: 50 cents. Two of three children under 13 (MA credit); premiums $43/$33.
Source: model/charts/fig4_retention.py; model/marginal_retention.py ·
data (CSV)
Verified against the form's own calculation scripts
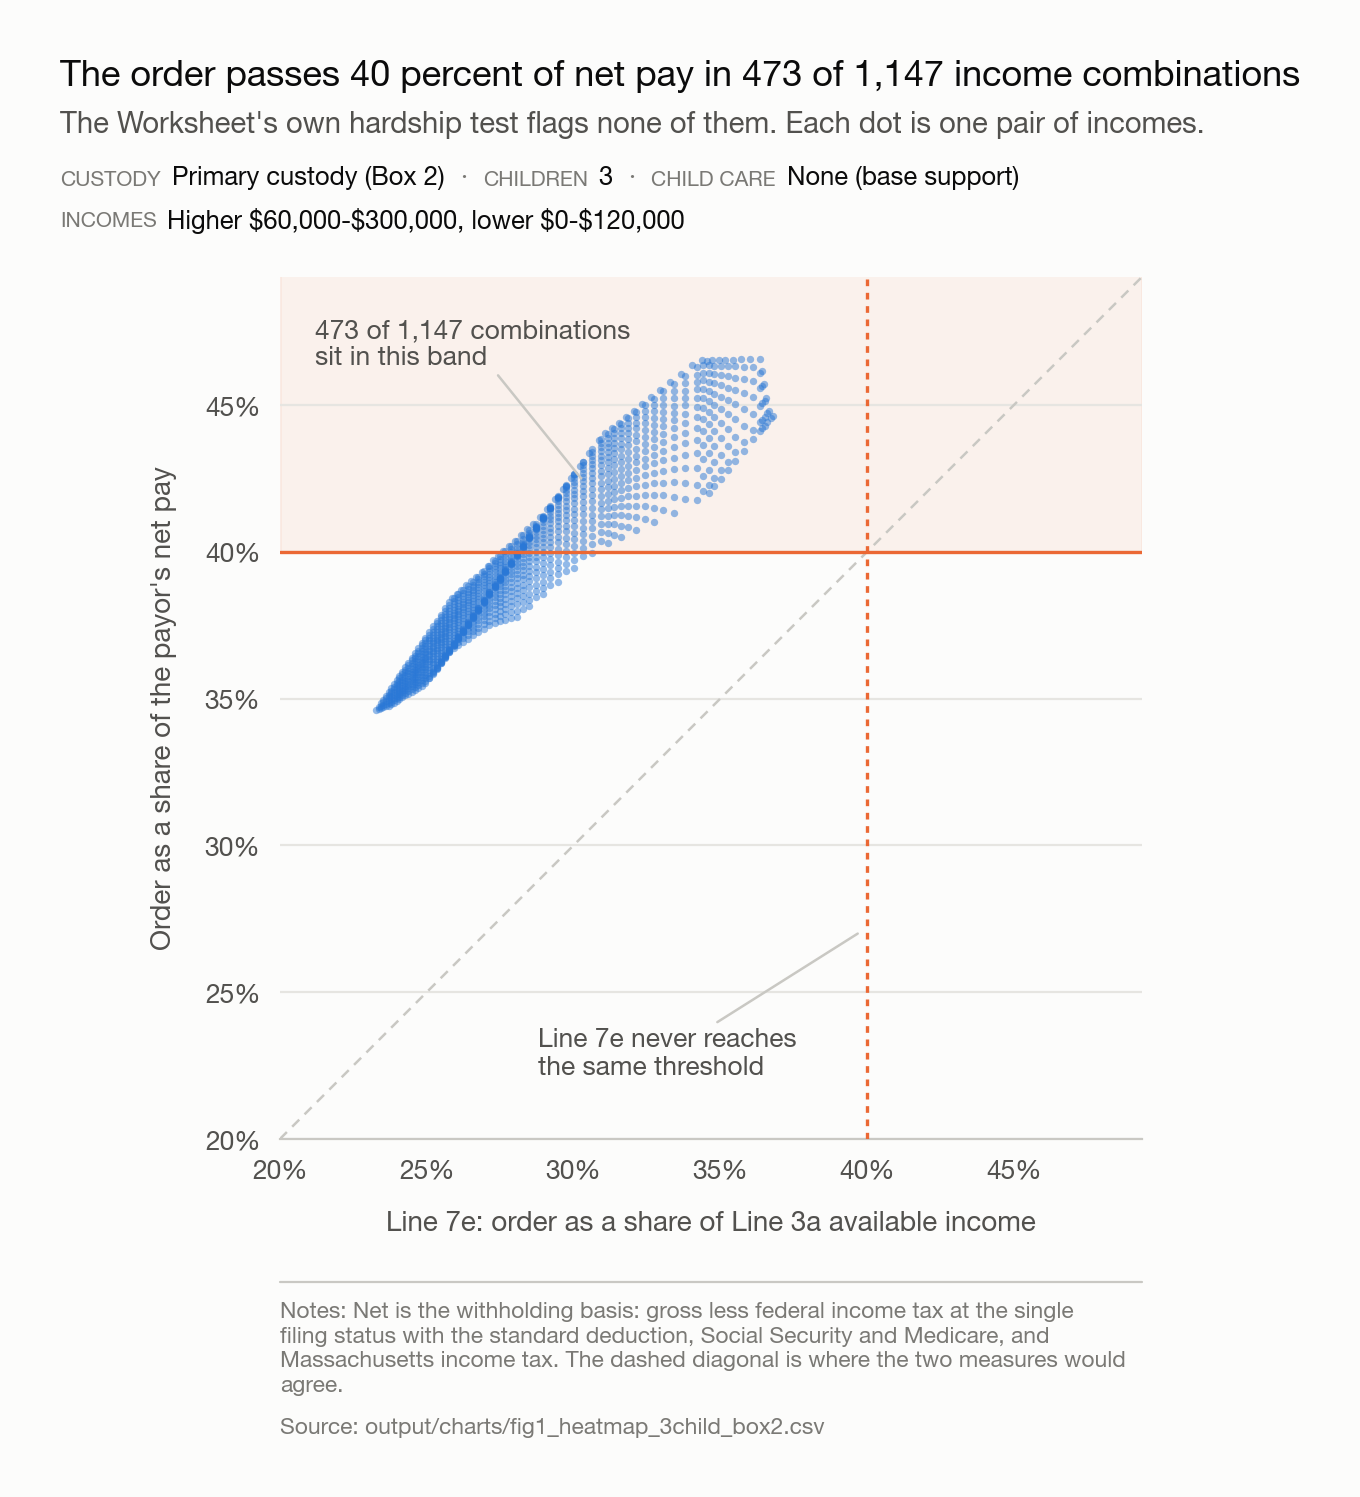
The order passes 40 percent of net pay in 473 of 1,147 income combinations.
The Worksheet's own hardship test flags none of them. Each dot is one pair of incomes.
- Custody
- Primary with the lower earner (Box 2)
- Children
- 3
- Child care
- None (base support)
- Incomes
- Vary (axes)
Across is what Line 7e prints; up is what the order actually takes. Every point sits above the dashed diagonal because Line 7e divides by a gross-derived figure, and the widest gap on this grid is 13.0 percentage points. Net is the withholding basis: gross less federal income tax at the single filing status with the standard deduction, Social Security and Medicare, and Massachusetts income tax.
Source: model/charts/fig12_net_pay_ceiling.py ·
data (CSV)
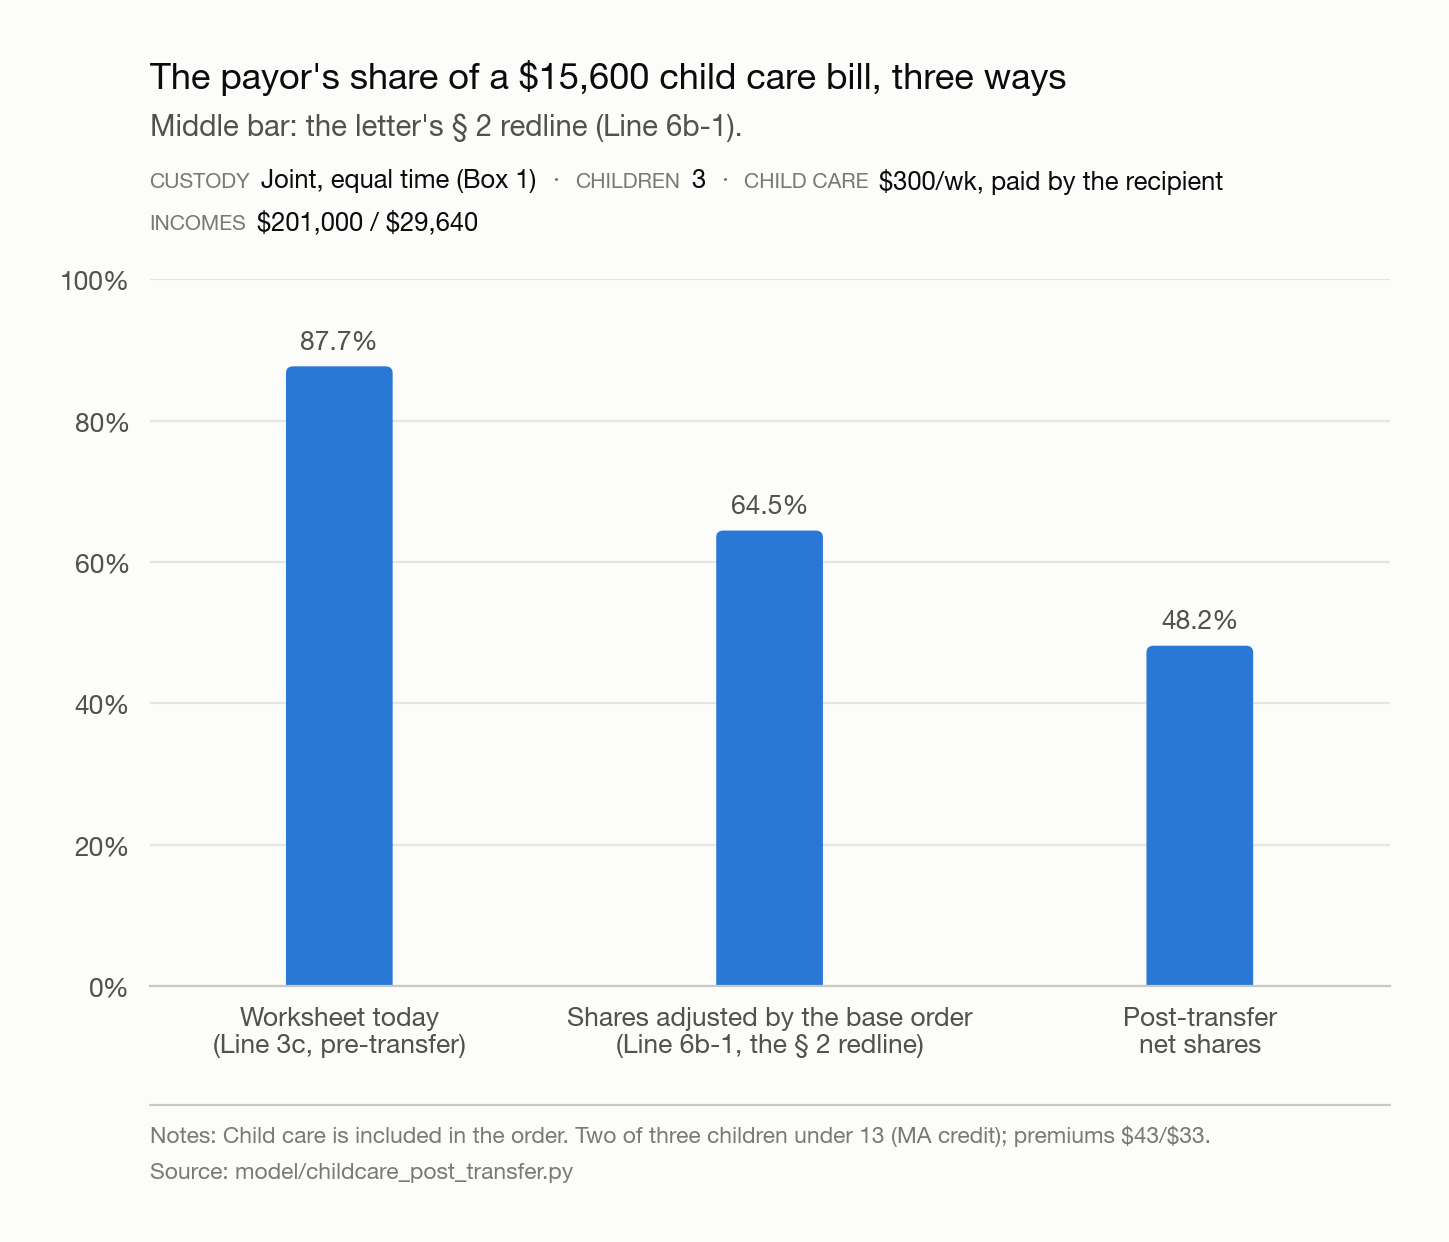
The Worksheet splits child care on income measured before the order moves money, so the payor pays more than his share of what is left
Verified against the form's own calculation scripts
The payor's share of a $15,600 child care bill, three ways to split it.
Third bar: what the comments ask for (new Lines 6b-1a and 6b-1).
- Custody
- Joint, equal time (Box 1)
- Children
- 3
- Child care
- $300/wk, paid by the recipient
- Incomes
- $201,000 / $29,640
Line 3c allocates 87.7 percent to the payor on pre-transfer income shares. The second bar is the fallback (new Line 6b-2), adjusting shares by the base order on a gross basis: 64.5 percent. The third bar is what the comments ask for: the same adjustment measured after federal and Massachusetts income tax and FICA, for a single filer claiming no exemptions, giving 53.0 percent. Child care is included in the order. Two of three children under 13 (MA credit); premiums $43/$33.
Source: model/charts/fig2_childcare.py; model/childcare_post_transfer.py ·
data (CSV)
Verified against the form's own calculation scripts
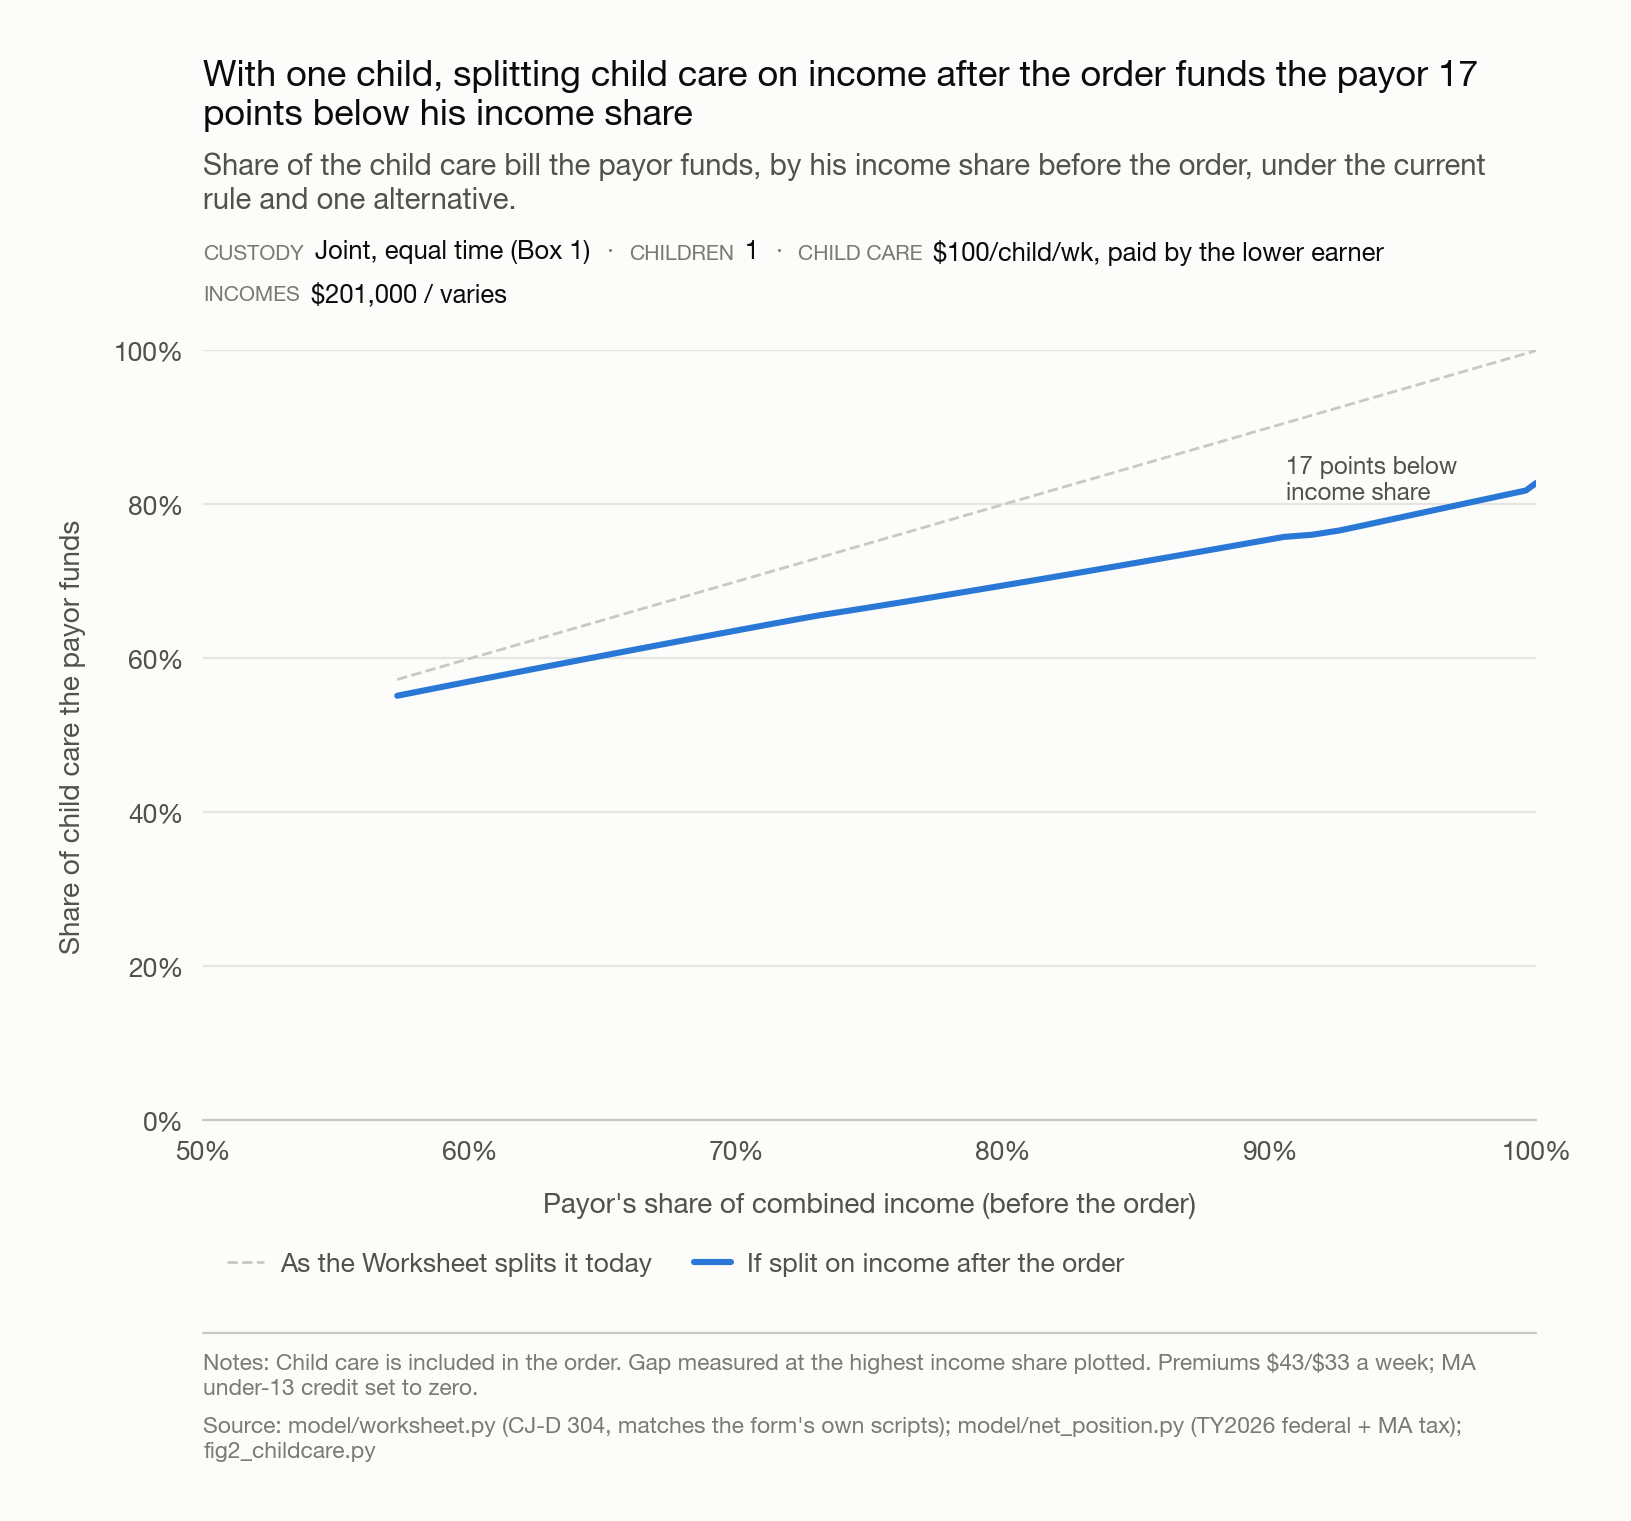
With one child, splitting child care on income after the order funds the payor 17 points below the payor's income share.
Share of the child care bill the payor funds, by the payor's income share before the order, under the current rule and one alternative.
- Custody
- Joint, equal time (Box 1)
- Children
- 1
- Child care
- $100/child/wk, paid by the lower earner
- Incomes
- $201,000 / varies
The gap is measured at the highest income share plotted on the CSV. Companion to E21 and E22 (two and three children): the gap widens with the number of children. Child care is included in the order. Premiums $43/$33 a week; MA under-13 credit set to zero.
Source: model/charts/fig2_childcare.py; model/worksheet.py; model/net_position.py ·
data (CSV)
Verified against the form's own calculation scripts
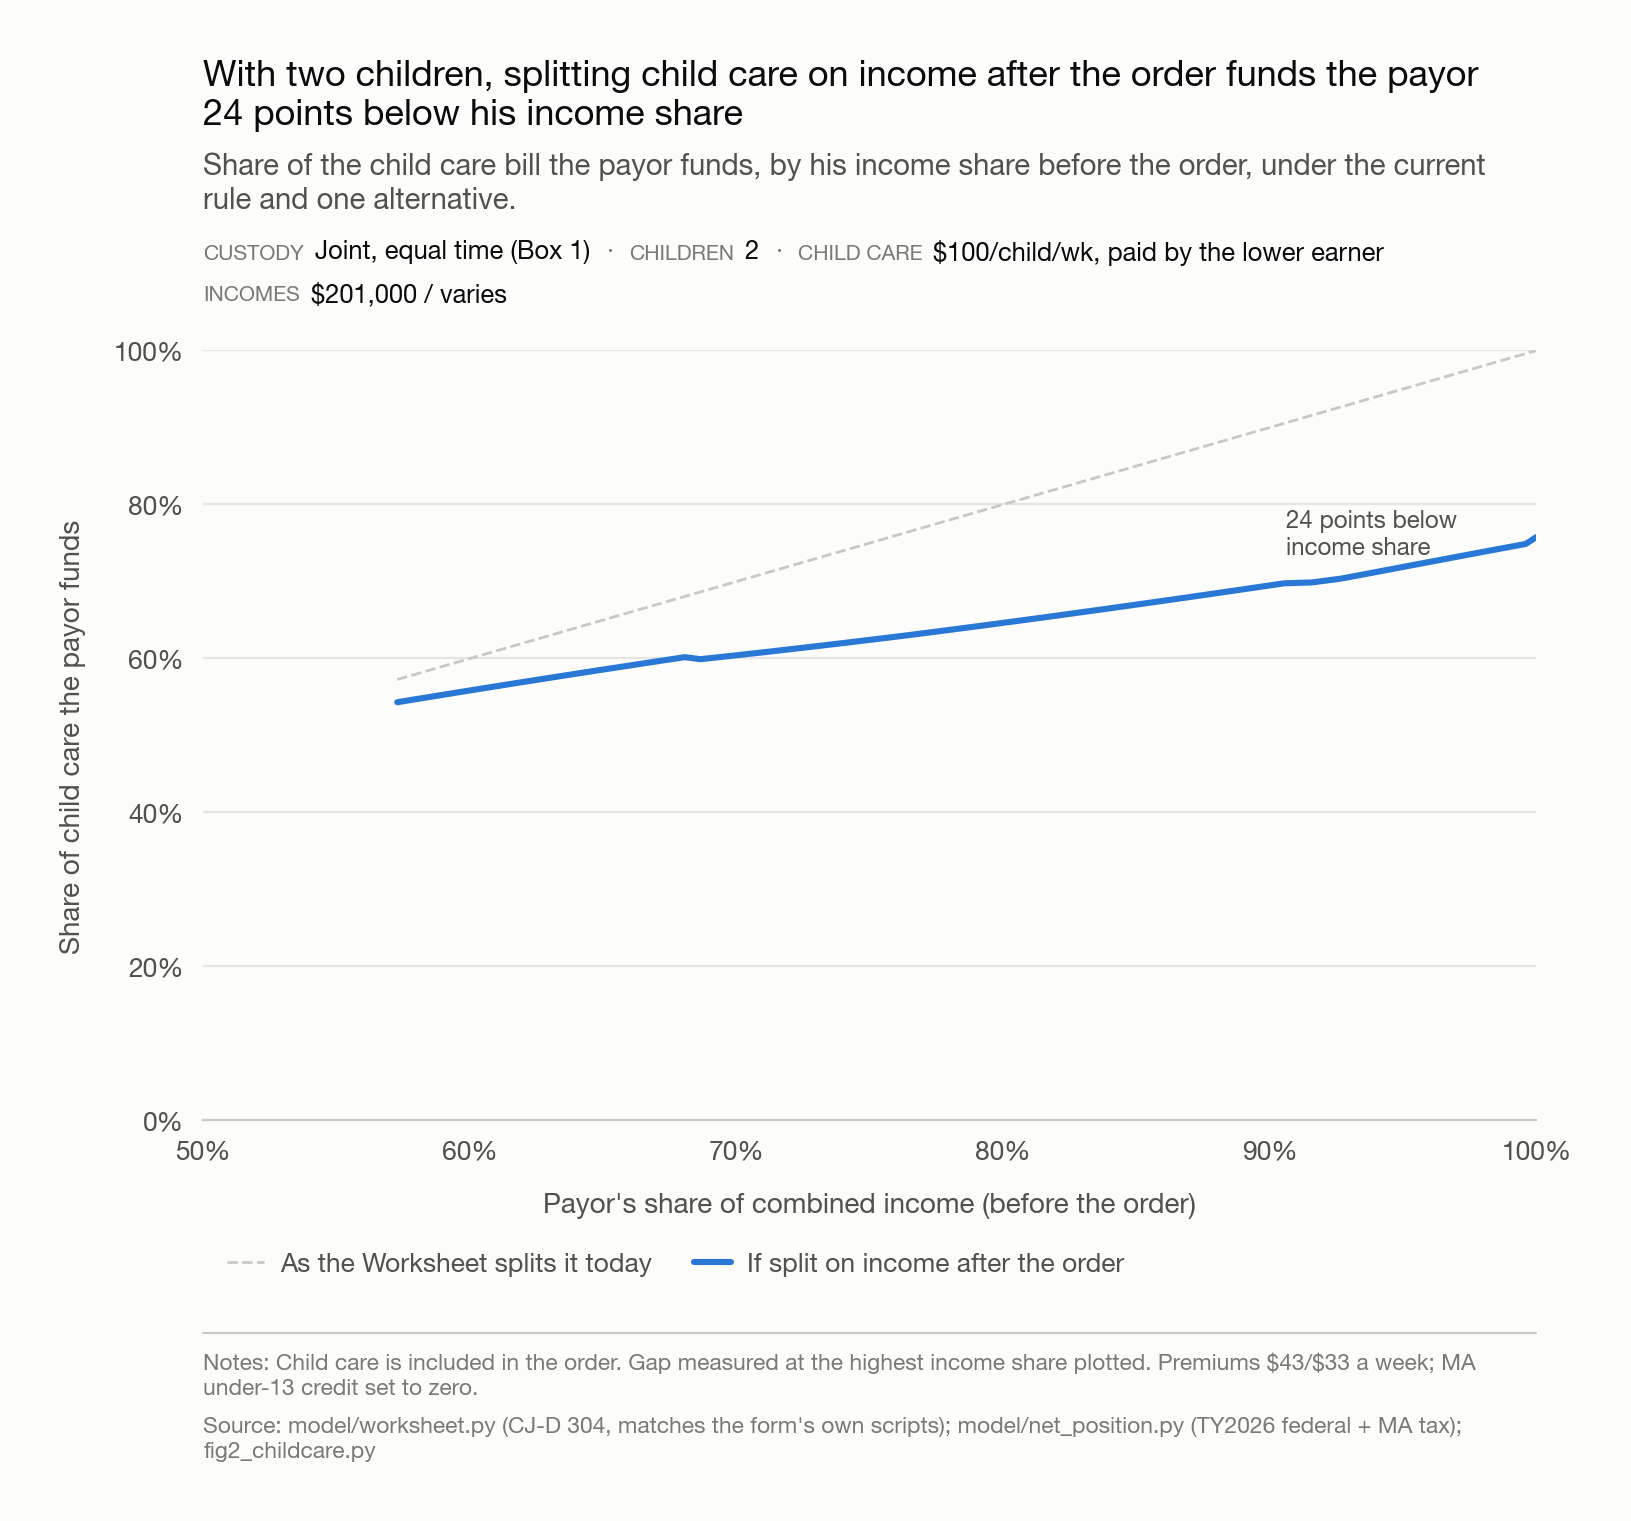
With two children, splitting child care on income after the order funds the payor 24 points below the payor's income share.
Share of the child care bill the payor funds, by the payor's income share before the order, under the current rule and one alternative.
- Custody
- Joint, equal time (Box 1)
- Children
- 2
- Child care
- $100/child/wk, paid by the lower earner
- Incomes
- $201,000 / varies
Same construction as E20, two children instead of one: the gap grows from 17 points to 24. Child care is included in the order. Premiums $43/$33 a week; MA under-13 credit set to zero.
Source: model/charts/fig2_childcare.py; model/worksheet.py; model/net_position.py ·
data (CSV)
Verified against the form's own calculation scripts
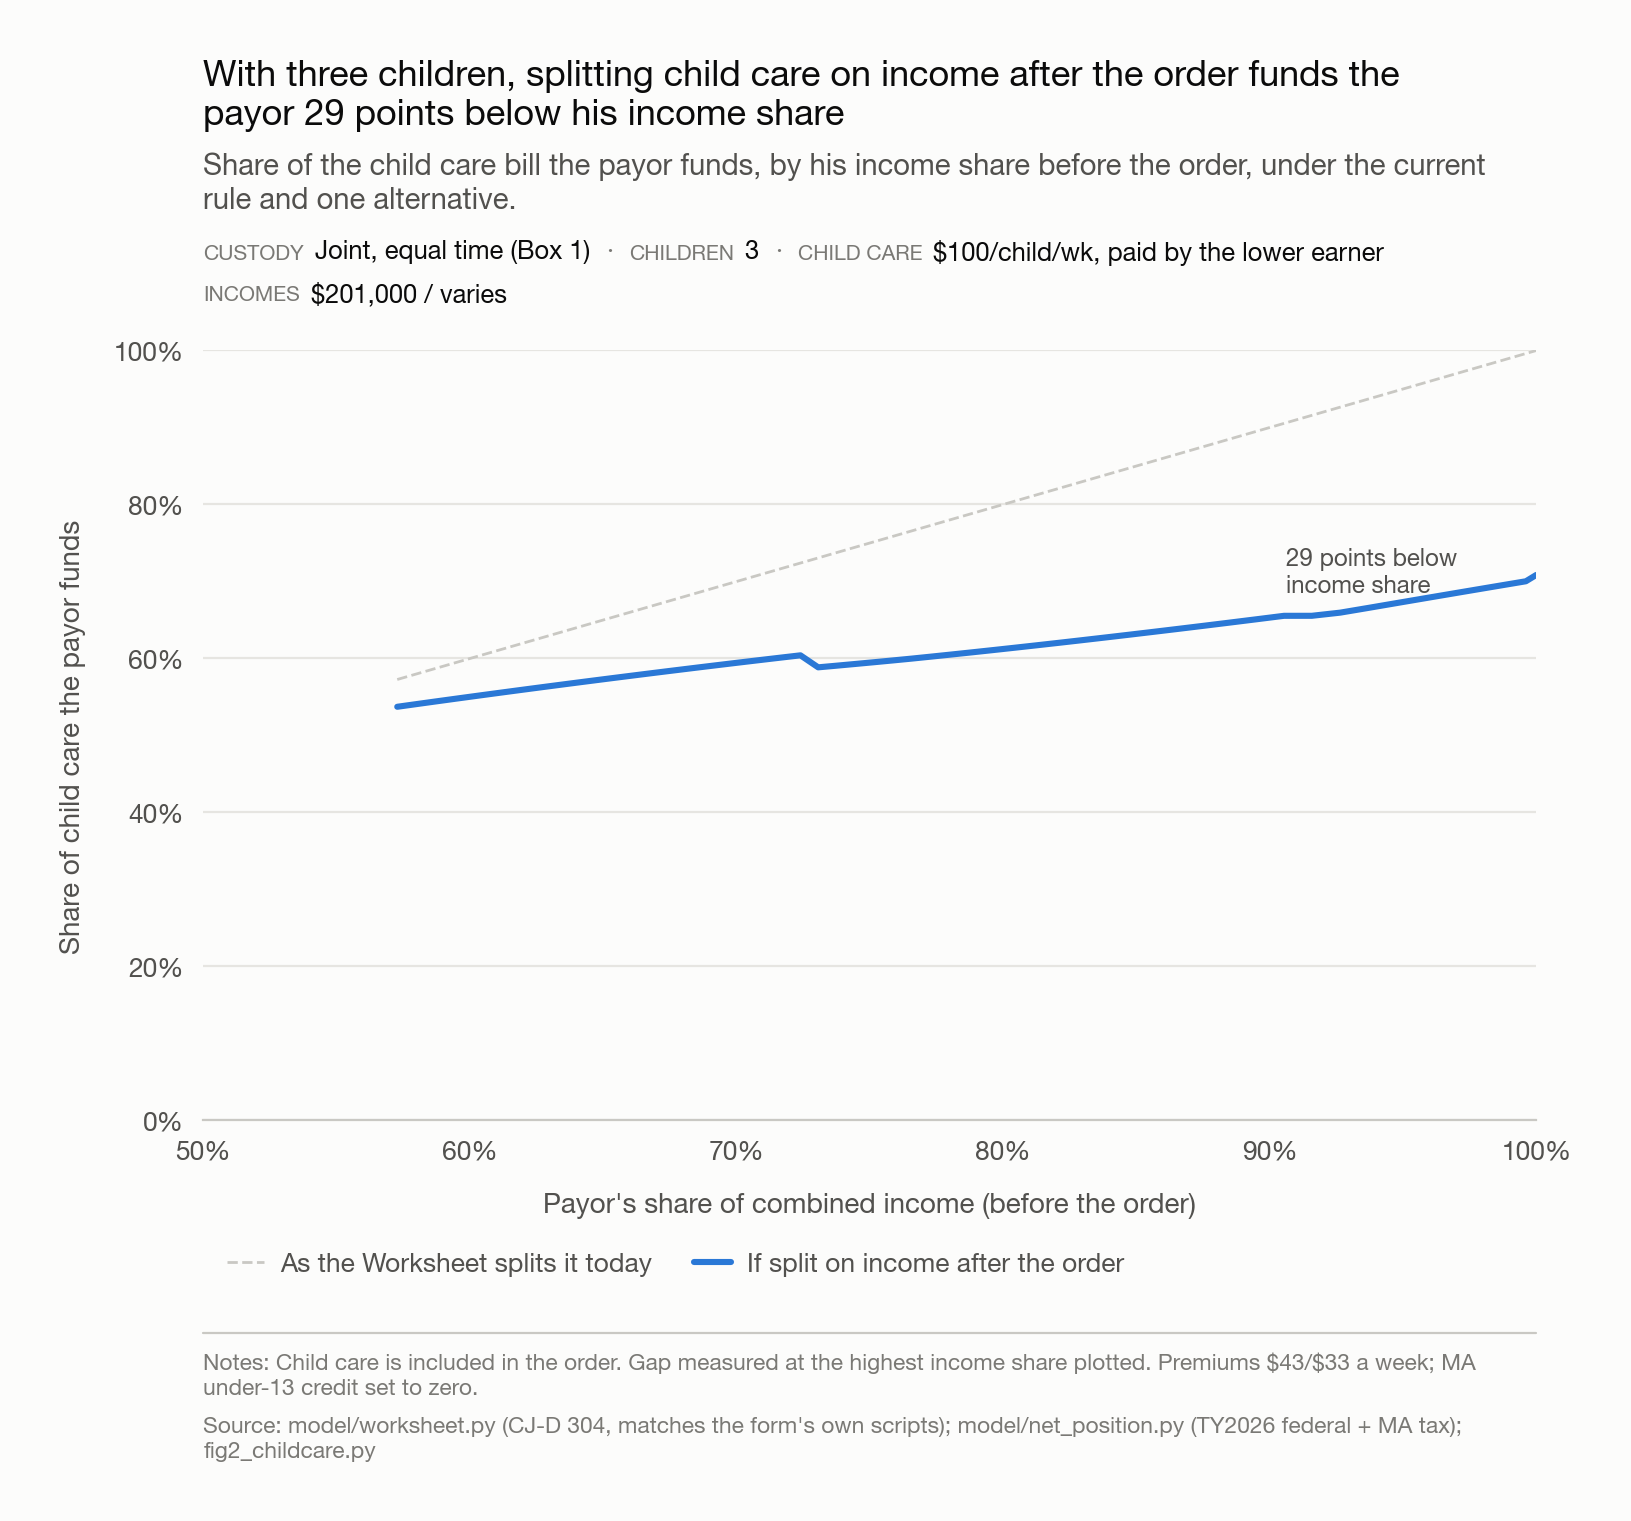
With three children, splitting child care on income after the order funds the payor 29 points below the payor's income share.
Share of the child care bill the payor funds, by the payor's income share before the order, under the current rule and one alternative.
- Custody
- Joint, equal time (Box 1)
- Children
- 3
- Child care
- $100/child/wk, paid by the lower earner
- Incomes
- $201,000 / varies
Same construction as E20 and E21, three children, the worked example's own count: the gap reaches 29 points. Child care is included in the order. Premiums $43/$33 a week; MA under-13 credit set to zero.
Source: model/charts/fig2_childcare.py; model/worksheet.py; model/net_position.py ·
data (CSV)
Verified against the form's own calculation scripts
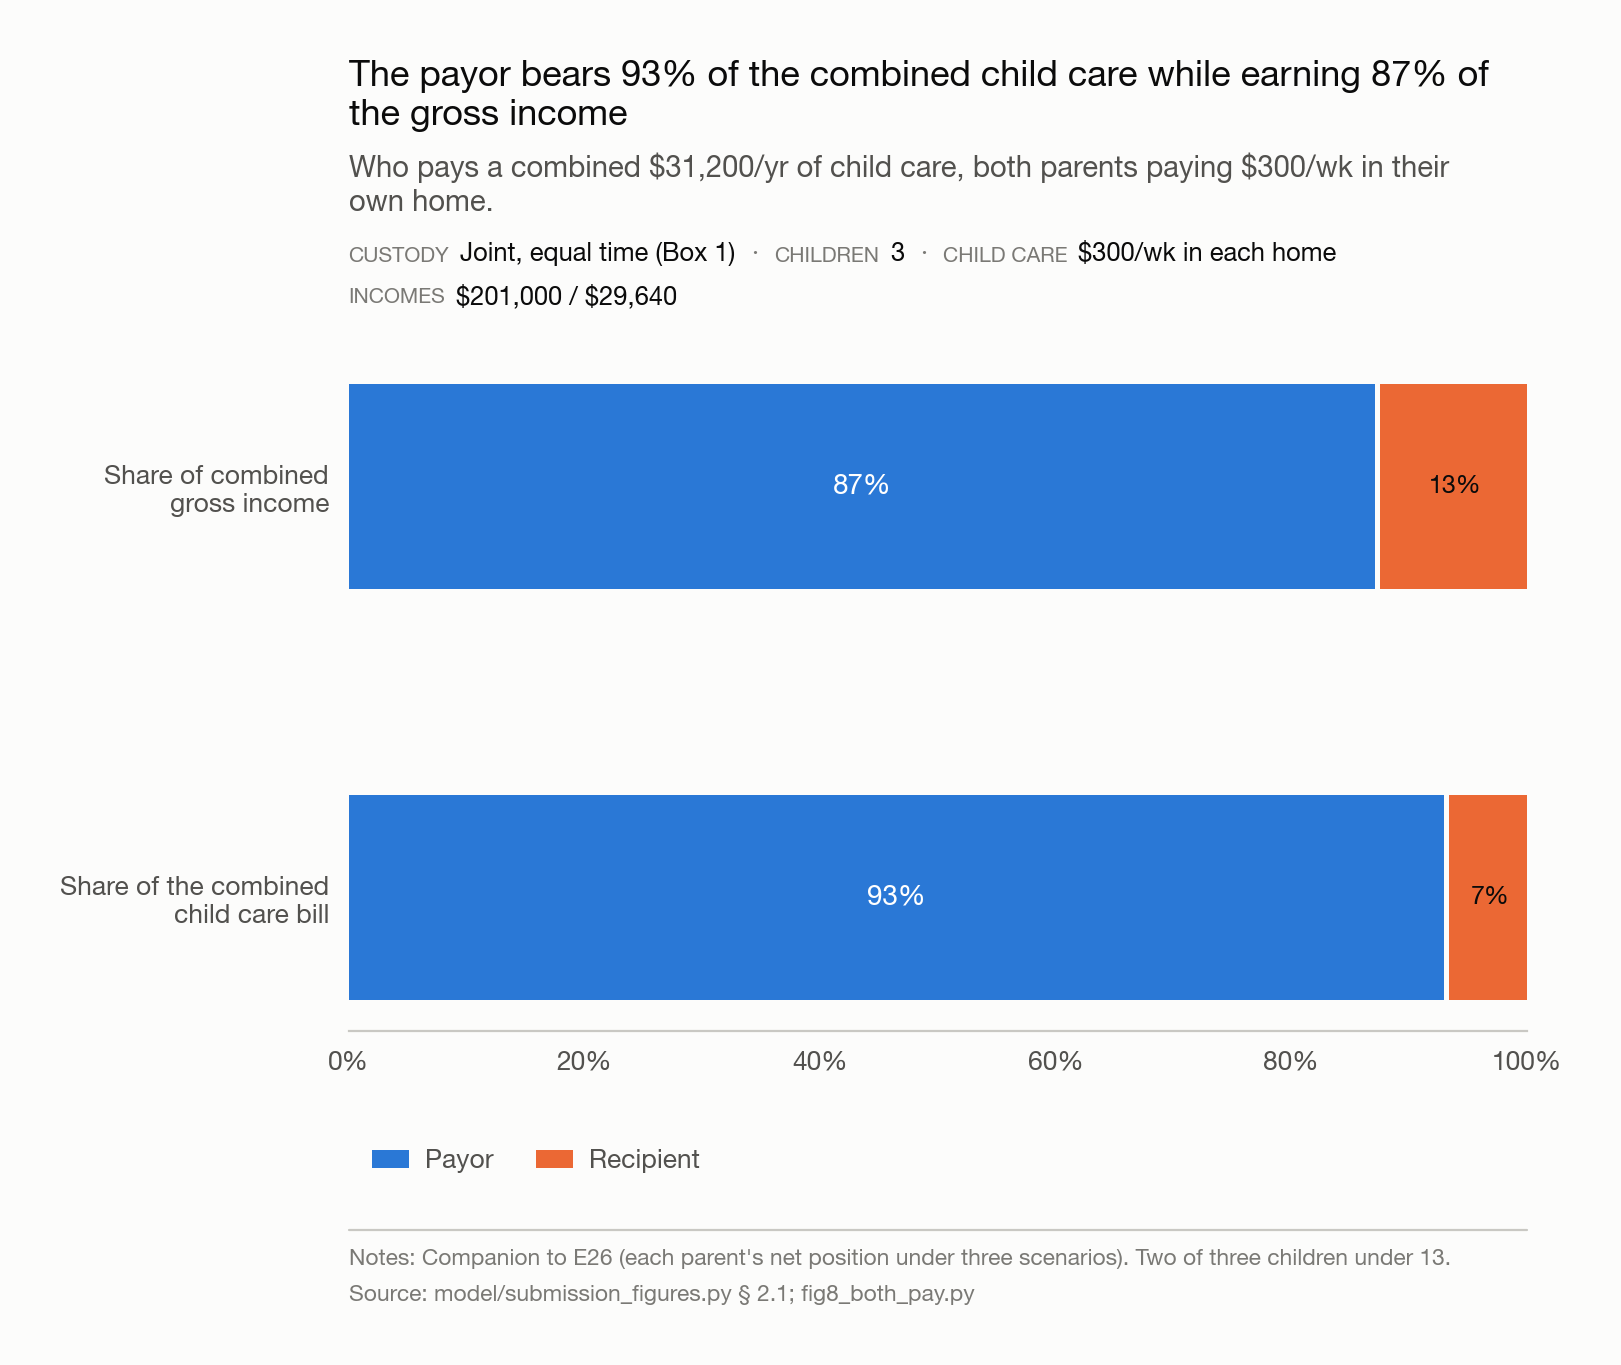
The payor bears 93 percent of the combined child care while earning 87 percent of the gross income.
Who pays a combined $31,200/yr of child care, both parents paying $300/wk in their own home.
- Custody
- Joint, equal time (Box 1)
- Children
- 3
- Child care
- $300/wk in each home
- Incomes
- $201,000 / $29,640
Each parent pays $300 a week during their own parenting time, the ordinary case at equal time. E26 shows each parent's resulting net position. Two of three children under 13; premiums $43/$33.
Source: model/submission_figures.py § 2.1; model/charts/fig8_both_pay.py ·
data (CSV)
Verified against the form's own calculation scripts
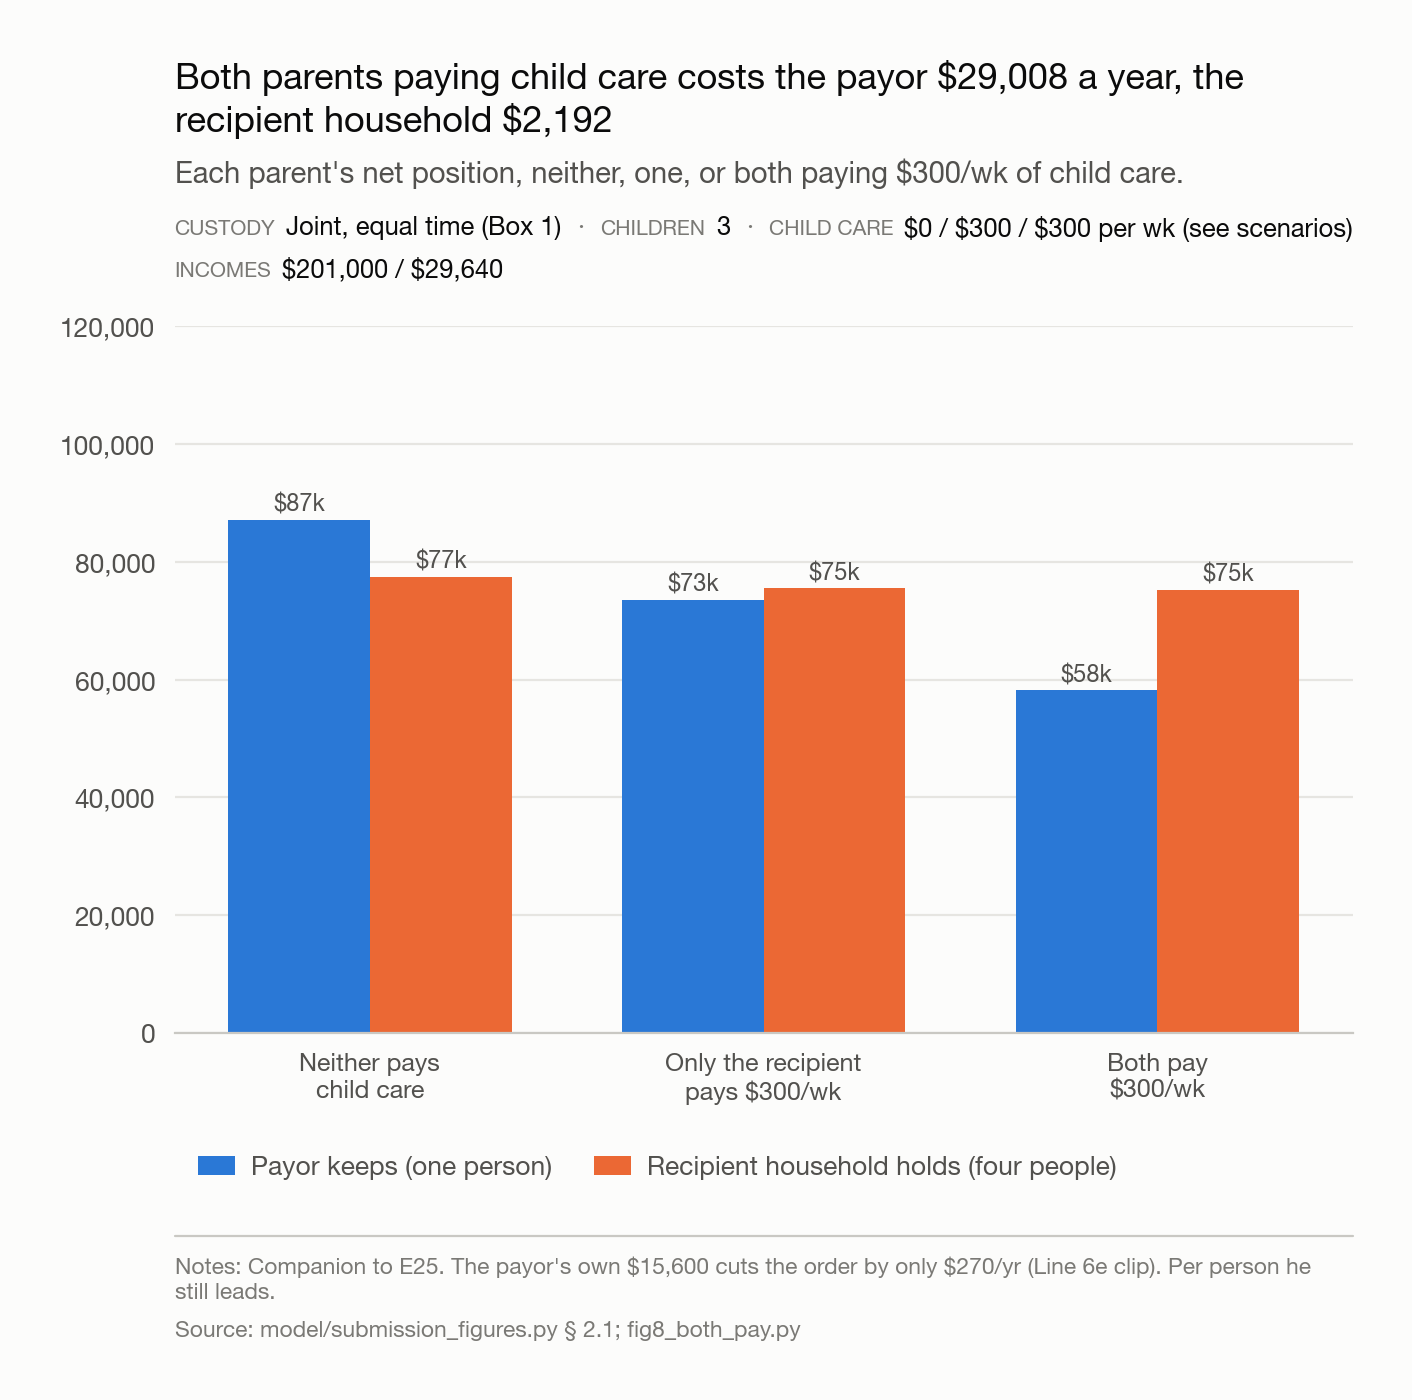
Both parents paying child care costs the payor $29,008 a year, the recipient household $2,192.
Each parent's net position, neither, one, or both paying $300/wk of child care.
- Custody
- Joint, equal time (Box 1)
- Children
- 3
- Child care
- $0 / $300 / $300 per wk (see scenarios)
- Incomes
- $201,000 / $29,640
The Worksheet allocates the recipient's cost to the payor through Line 6b, but credits the payor's own cost back through Line 6e at about two cents on the dollar: that $15,600 reduces the order by only $270 a year. Order plus the payor's own child care reaches 58.4 percent of net income while Line 7e reads 33 percent. Per person the payor still leads ($58,163 vs. $18,801 each for four). Two of three children under 13; premiums $43/$33.
Source: model/submission_figures.py § 2.1; model/charts/fig8_both_pay.py ·
data (CSV)
The equal-time credit collapses as the income gap widens, and splitting the children between two homes cuts the order
Verified against the form's own calculation scripts
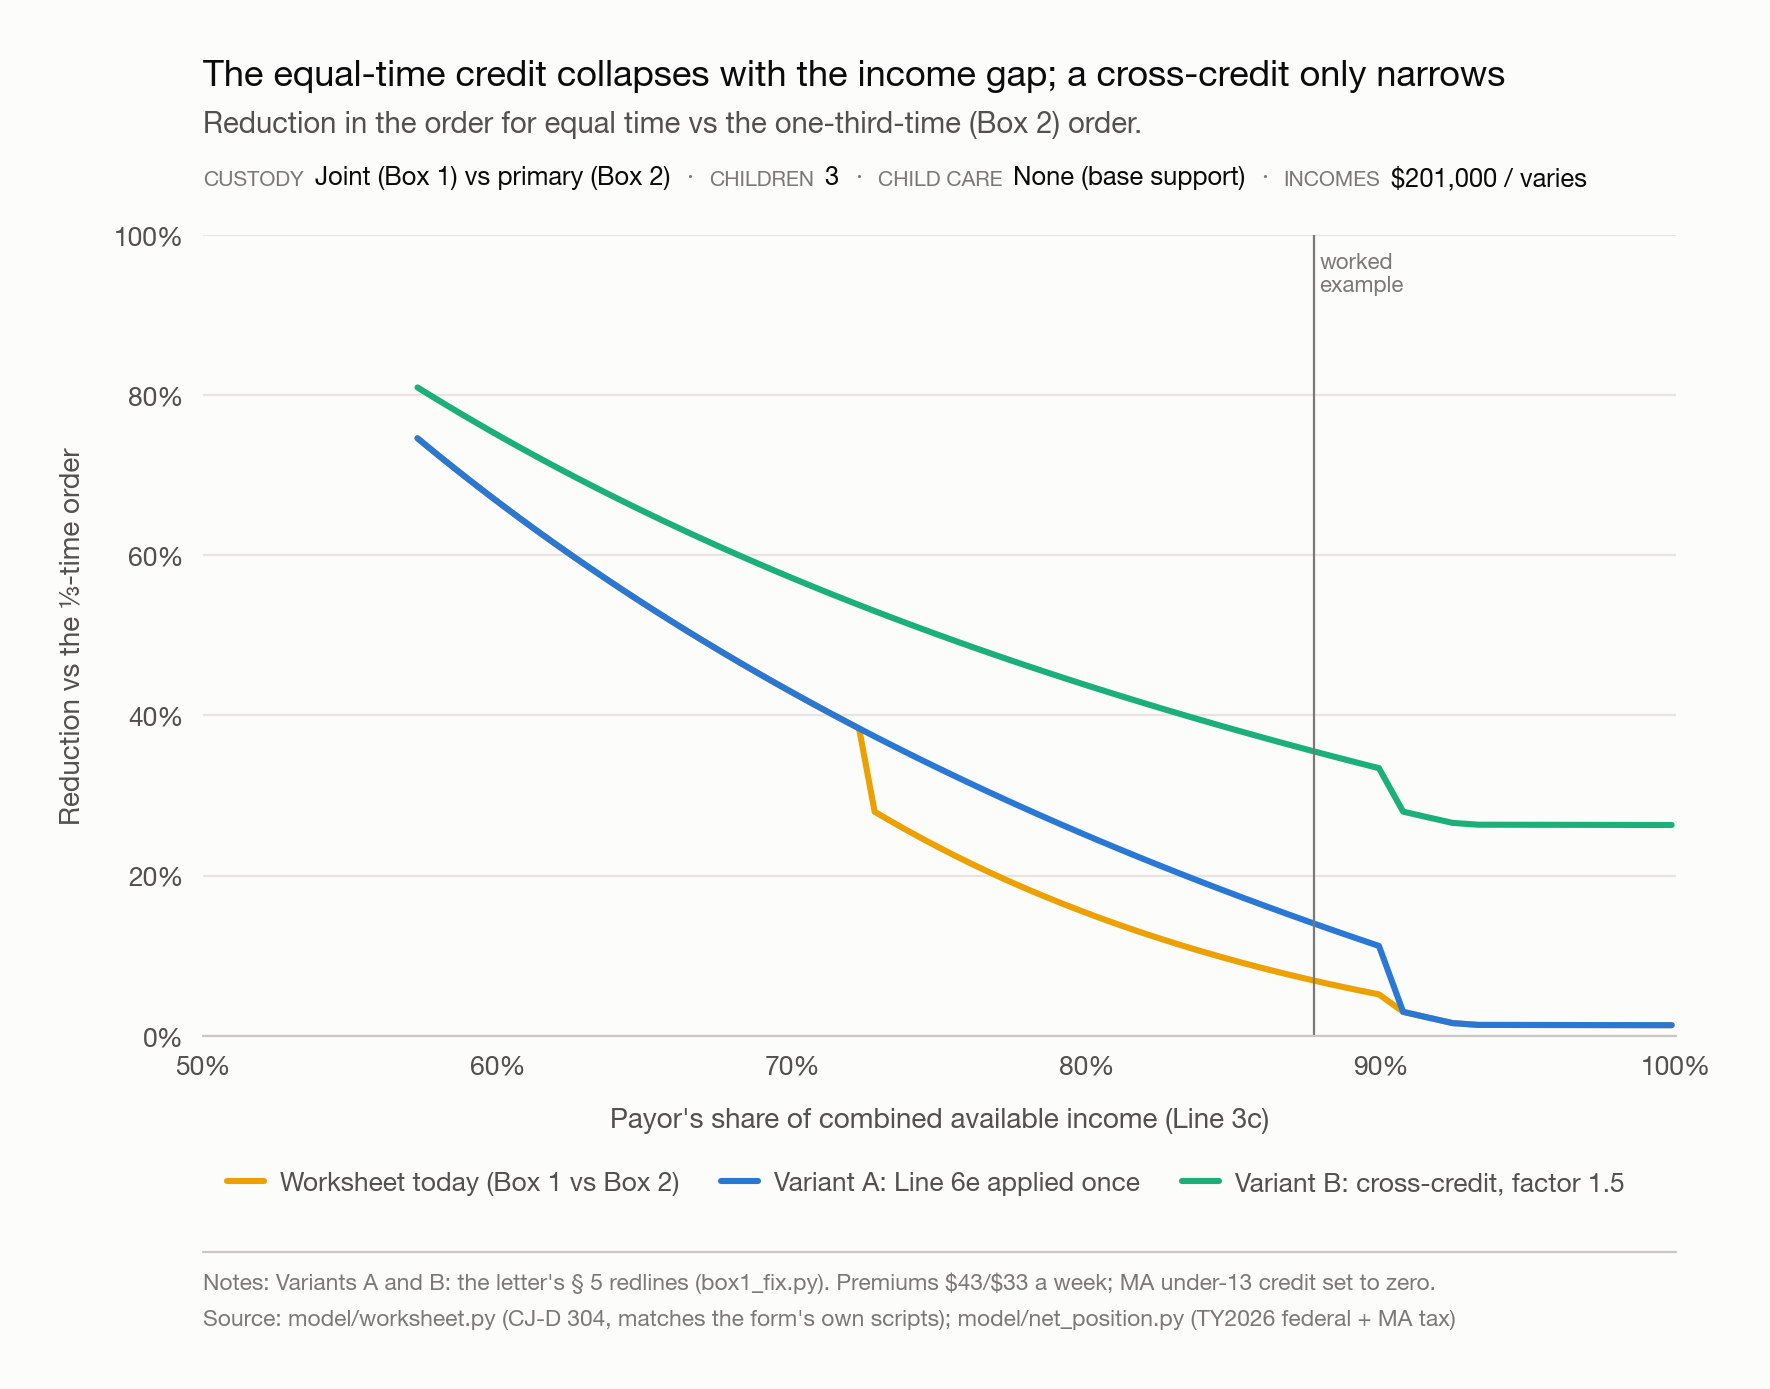
The Worksheet's equal-time credit collapses as the income gap widens.
Reduction in the order for equal time, against the Box 2 order (the paying parent has the children about a third of the time).
- Custody
- Joint (Box 1) vs primary (Box 2)
- Children
- 3
- Child care
- None (base support)
- Incomes
- $201,000 / varies
The reduction falls from about 75 percent at a 57 percent payor income share to 7 percent at 88 percent and 1 percent at 96 percent: no parenting-time quantity enters any line. Variant A, applying Line 6e once, lifts the curve. Variant B, the standard cross-credit at a 1.5 duplication factor used by 18 states and DC, stops it collapsing. Both are the letter's § 5 redlines.
Source: model/charts/exhibits.py; model/worksheet.py; model/net_position.py; model/box1_fix.py ·
data (CSV)
Verified against the form's own calculation scripts
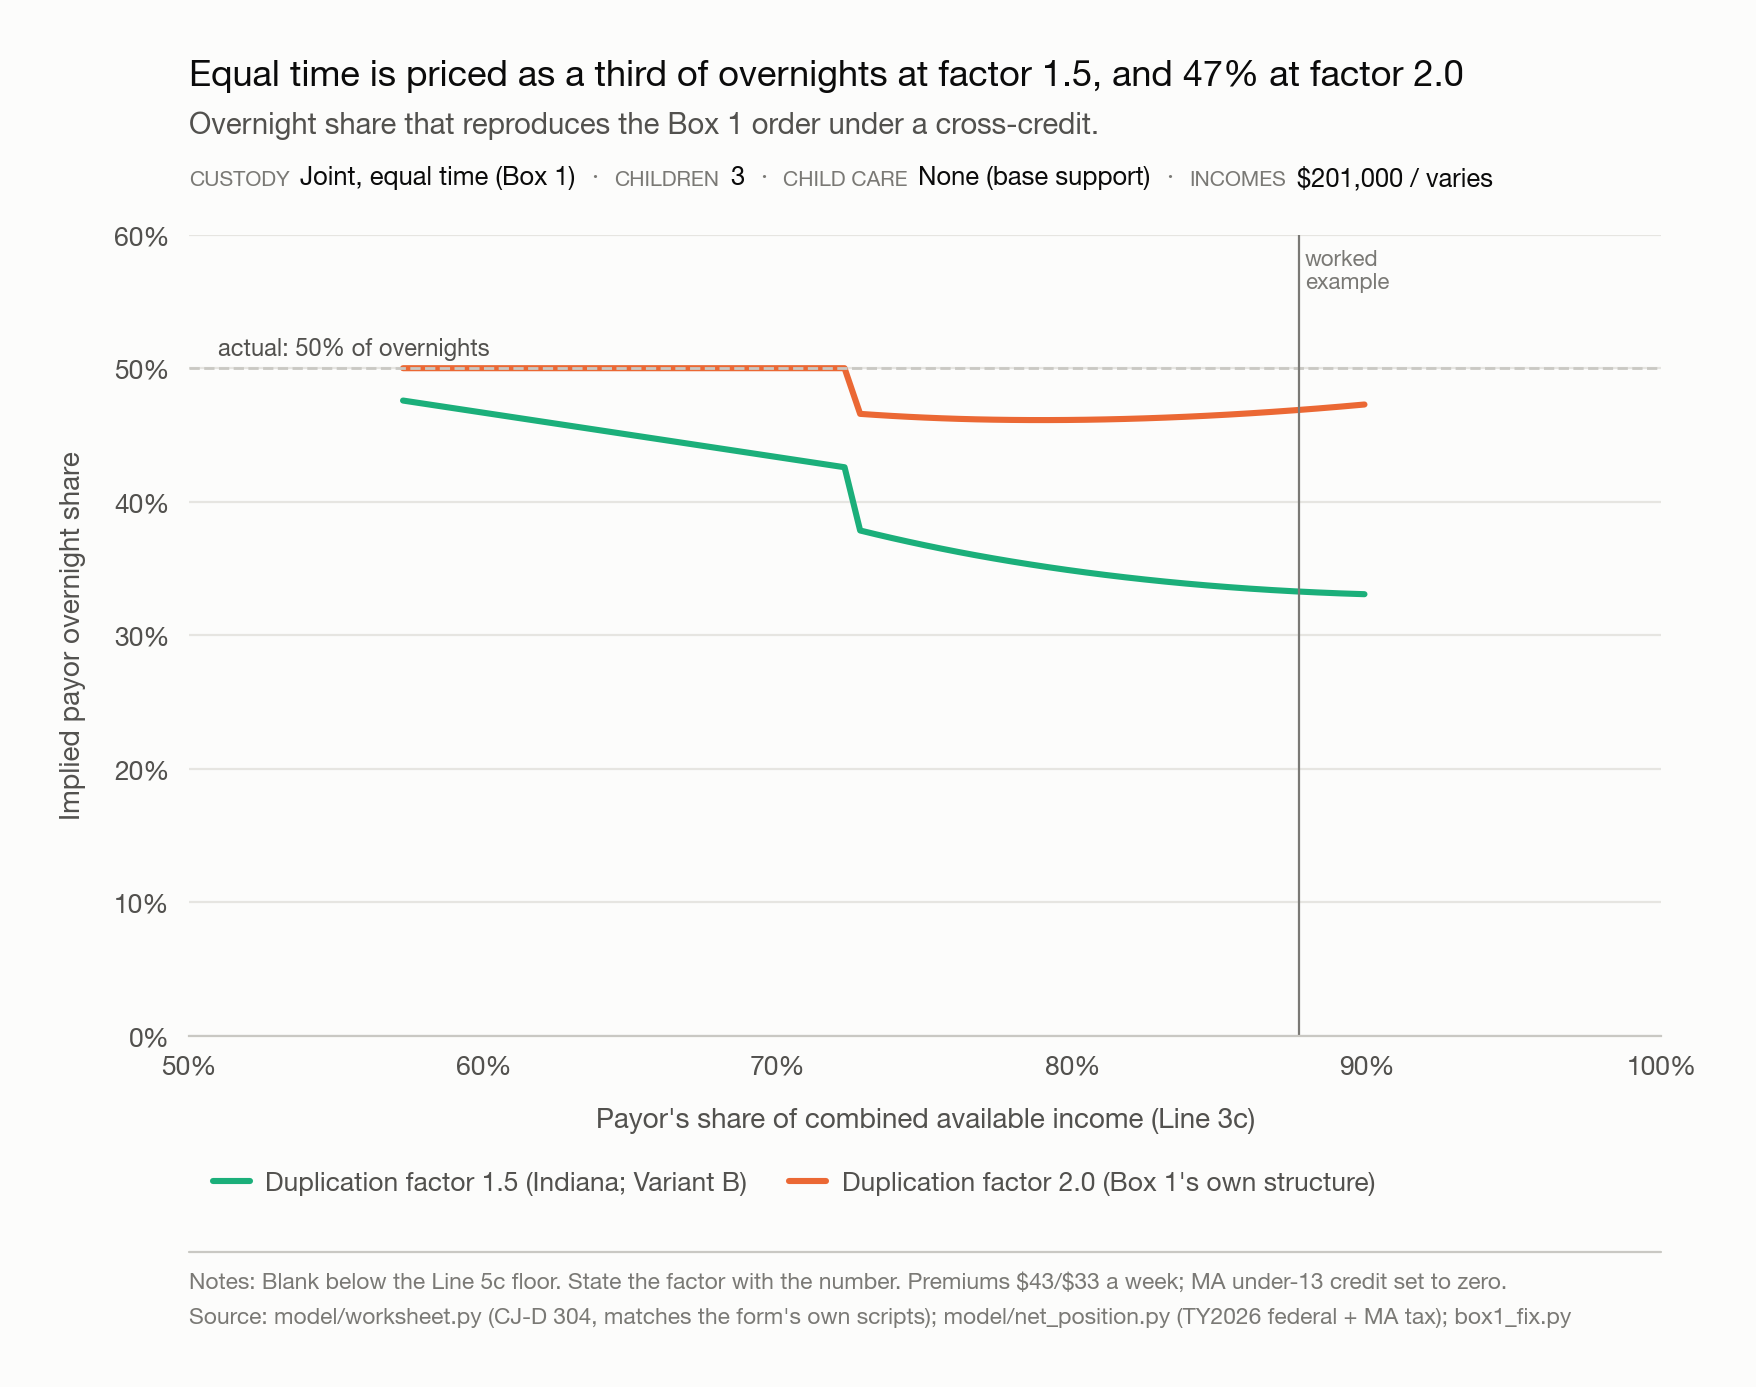
The equal-time credit is what a standard formula pays a parent who has the children one night in three.
Massachusetts's credit for half the nights, converted into the overnight share a standard formula would need to produce it.
- Custody
- Joint (Box 1) vs primary (Box 2)
- Children
- 3
- Child care
- None (base support)
- Incomes
- $201,000 / varies
The duplication factor decides the number: 33.3 percent at a factor of 1.5, 46.9 percent at 2.0. State the factor beside the number always. Blank below the Line 5c floor, where the order is no longer a cross-credit.
Source: model/charts/exhibits.py; model/worksheet.py; model/net_position.py; model/box1_fix.py ·
data (CSV)
Verified against the form's own calculation scripts
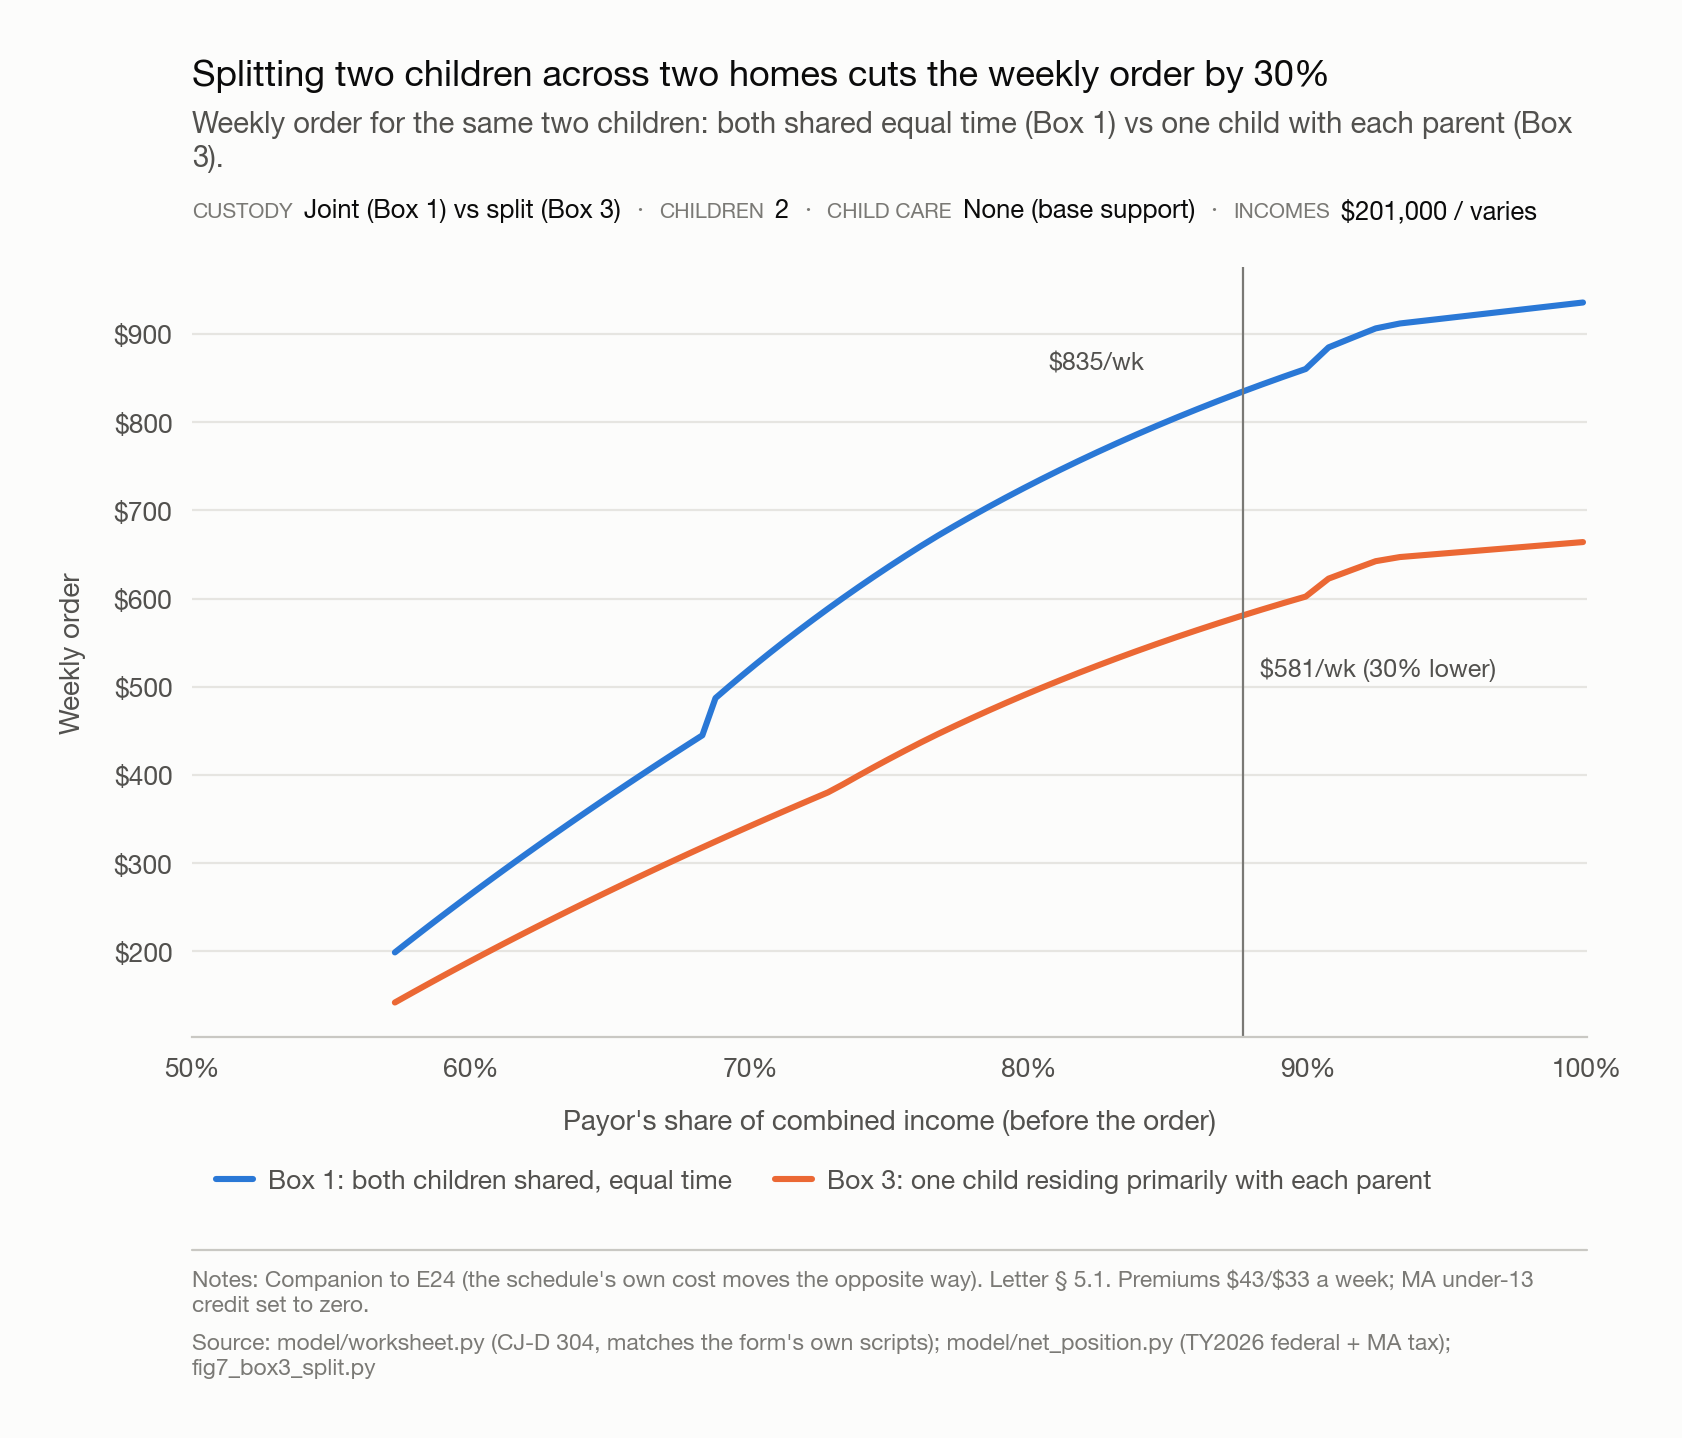
Splitting two children across two homes cuts the weekly order by 30 percent.
Weekly order under Box 1 and Box 3 for the same two children.
- Custody
- Joint (Box 1) vs split (Box 3)
- Children
- 2
- Child care
- None (base support)
- Incomes
- $201,000 / varies
Under Box 1 both children are shared equal time; under Box 3 one lives primarily with each parent. The payor's care responsibility is one child-share either way, but Line 6g nets the columns on the one-child schedule (Table B 1.00 against 1.40), so Box 3 comes out at 70 percent of Box 1 ($581 against $835 a week) even though the arrangement costs more on the schedule's own measure (E24). This one cuts against the lower earner. Premiums $43/$33 a week; MA under-13 credit set to zero.
Source: model/charts/fig7_box3_split.py; model/worksheet.py; model/net_position.py ·
data (CSV): curve,
worked-example point
Verified against the form's own calculation scripts
Two homes, one child each, cost 43 percent more on the schedule than one home with two.
What the guidelines assume each arrangement costs: one home raising two children vs two homes each raising one.
- Custody
- Joint (Box 1) vs split (Box 3)
- Children
- 2
- Child care
- None (base support)
- Incomes
- $201,000 / varies
Table B charges one home raising two children 1.40 times the one-child amount; two homes raising one child each are charged 1.00 twice, 2.00 combined. The order moves the opposite way (E23): the more expensive arrangement produces the smaller transfer.
Source: model/charts/fig7_box3_split.py; model/worksheet.py; model/net_position.py ·
data (CSV): curve,
worked-example point
Massachusetts orders the most of the fifty at equal time, and more than almost every state orders at primary custody
One set of incomes; see method
At equal parenting time, Massachusetts orders the most of the fifty states.
Monthly order at one set of incomes. Georgia held out.
- Custody
- Joint, equal time (Box 1)
- Children
- 3
- Child care
- None (base support)
- Incomes
- $201,000 / $29,640
Fifty of fifty-one jurisdictions passed every check; Georgia is held out because its own enacted formula, reproduced by its own calculator, gives a lower order under primary custody than under equal time. Each state's amount comes from its own guidelines, worked out twice and checked for errors. Own premiums ($43/$33) as each state treats them. One worked example; the ranking generalizes to nothing else.
Source: model/charts/fig5_states.py ·
data (JSON) ·
data (CSV)
Full ranking behind E11: all 50 jurisdictions
| Rank | Jurisdiction | Monthly order |
|---|---|---|
| 1 | Massachusetts, this page’s worked example | $4,388.48 |
| 2 | New York | $4,067.61 |
| 3 | New Hampshire | $3,838.66 |
| 4 | Texas | $3,510.00 |
| 5 | Missouri | $3,139.00 |
| 6 | Connecticut | $3,138.20 |
| 7 | Wisconsin | $3,117.35 |
| 8 | New Jersey | $3,002.31 |
| 9 | North Dakota | $2,939.00 |
| 10 | Maine | $2,899.02 |
| 11 | Washington | $2,819.56 |
| 12 | Hawaii | $2,774.00 |
| 13 | Rhode Island | $2,684.45 |
| 14 | Colorado | $2,652.32 |
| 15 | Iowa | $2,630.25 |
| 16 | Ohio | $2,564.15 |
| 17 | California | $2,424.32 |
| 18 | Pennsylvania | $2,378.42 |
| 19 | Alaska | $2,367.95 |
| 20 | Maryland | $2,309.54 |
| 21 | Kansas | $2,296.63 |
| 22 | Indiana | $2,283.25 |
| 23 | Delaware | $2,281.35 |
| 24 | District of Columbia | $2,253.73 |
| 25 | Louisiana | $2,227.23 |
| 26 | Arkansas | $2,118.68 |
| 27 | Mississippi | $2,097.44 |
| 28 | Wyoming | $1,900.85 |
| 29 | North Carolina | $1,883.12 |
| 30 | Illinois | $1,881.45 |
| 31 | Virginia | $1,872.18 |
| 32 | Nevada | $1,842.80 |
| 33 | Tennessee | $1,833.00 |
| 34 | South Carolina | $1,832.22 |
| 35 | New Mexico | $1,823.64 |
| 36 | Idaho | $1,794.22 |
| 37 | South Dakota | $1,788.96 |
| 38 | Alabama | $1,746.00 |
| 39 | Florida | $1,735.21 |
| 40 | West Virginia | $1,724.21 |
| 41 | Vermont | $1,686.42 |
| 42 | Nebraska | $1,475.23 |
| 43 | Montana | $1,461.00 |
| 44 | Michigan | $1,445.25 |
| 45 | Arizona | $1,309.36 |
| 46 | Oklahoma | $1,284.42 |
| 47 | Minnesota | $1,174.71 |
| 48 | Kentucky | $1,087.80 |
| 49 | Oregon | $1,072.00 |
| 50 | Utah | $1,058.31 |
One set of incomes; see method
With the lower earner primary, only Hawaii orders more than Massachusetts.
Monthly order at one set of incomes. Georgia held out. First of a pair with E17.
- Custody
- Primary with the lower earner (Box 2)
- Children
- 3
- Child care
- None (base support)
- Incomes
- $201,000 / $29,640
Same worked example, children primarily with the lower earner. Hawaii's design, shared with Delaware and Montana, exhausts the self-support reserve differently from an income-shares schedule at this income gap. Same states, axis range, colors, and ordering rule as E17, so the two read as a pair.
Source: model/charts/fig5_states.py ·
data (JSON) ·
data (CSV)
Full ranking behind E12: all 50 jurisdictions
| Rank | Jurisdiction | Monthly order |
|---|---|---|
| 1 | Hawaii | $5,821.00 |
| 2 | Massachusetts, this page’s worked example | $4,714.22 |
| 3 | Wisconsin | $4,491.71 |
| 4 | New York | $4,067.61 |
| 5 | Delaware | $3,990.73 |
| 6 | New Hampshire | $3,838.66 |
| 7 | Kansas | $3,838.03 |
| 8 | Iowa | $3,744.73 |
| 9 | Texas | $3,510.00 |
| 10 | District of Columbia | $3,467.96 |
| 11 | Alaska | $3,462.96 |
| 12 | California | $3,436.04 |
| 13 | Maryland | $3,295.11 |
| 14 | Louisiana | $3,269.06 |
| 15 | North Dakota | $3,219.00 |
| 16 | Missouri | $3,139.00 |
| 17 | Connecticut | $3,138.20 |
| 18 | Rhode Island | $3,123.22 |
| 19 | Colorado | $3,090.30 |
| 20 | Pennsylvania | $3,086.76 |
| 21 | Montana | $3,073.50 |
| 22 | Illinois | $3,037.90 |
| 23 | New Jersey | $3,002.31 |
| 24 | North Carolina | $2,934.30 |
| 25 | Maine | $2,899.02 |
| 26 | Washington | $2,819.56 |
| 27 | Michigan | $2,808.44 |
| 28 | Wyoming | $2,801.97 |
| 29 | New Mexico | $2,795.32 |
| 30 | Alabama | $2,736.00 |
| 31 | Virginia | $2,672.09 |
| 32 | South Carolina | $2,669.21 |
| 33 | South Dakota | $2,623.12 |
| 34 | Vermont | $2,594.42 |
| 35 | Mississippi | $2,564.76 |
| 36 | Ohio | $2,564.15 |
| 37 | Idaho | $2,549.85 |
| 38 | Indiana | $2,548.03 |
| 39 | West Virginia | $2,518.77 |
| 40 | Florida | $2,512.99 |
| 41 | Nevada | $2,485.00 |
| 42 | Nebraska | $2,402.03 |
| 43 | Arkansas | $2,349.64 |
| 44 | Utah | $2,332.66 |
| 45 | Arizona | $2,290.06 |
| 46 | Minnesota | $2,271.30 |
| 47 | Tennessee | $2,031.00 |
| 48 | Oklahoma | $2,008.78 |
| 49 | Kentucky | $1,871.67 |
| 50 | Oregon | $1,772.00 |
One set of incomes; see method
In Massachusetts and 22 other states, having the children a third of the time lowers the order by nothing.
Twenty-eight states give that parent a formula credit; 23 do not. Blue: a credit at 122 overnights a year. Grey: none.
- Counted
- Any formula credit at 122 overnights
- Children
- 3
- Child care
- None
- Incomes
- $201,000 / $29,640
A count, not a dollar amount. Massachusetts is among the 23: its Box 2 already assumes the paying parent has the children about a third of the time, without a discrete credit for it. In the one clean pairing with a credit-giving state the dollar effect runs the other way, so this count is a structural fact and nothing more.
Source: model/charts/fig5_states.py ·
data (JSON)
Full table behind E13: all 51 jurisdictions
| Jurisdiction | Formula credit at 122 overnights |
|---|---|
| Alabama | No |
| Alaska | Yes |
| Arizona | Yes |
| Arkansas | No |
| California | Yes |
| Colorado | Yes |
| Connecticut | No |
| Delaware | Yes |
| District of Columbia | No |
| Florida | Yes |
| Georgia | Yes |
| Hawaii | No |
| Idaho | Yes |
| Illinois | No |
| Indiana | Yes |
| Iowa | No |
| Kansas | No |
| Kentucky | Yes |
| Louisiana | No |
| Maine | No |
| Maryland | Yes |
| Massachusetts, this page’s worked example | No |
| Michigan | Yes |
| Minnesota | Yes |
| Mississippi | No |
| Missouri | Yes |
| Montana | Yes |
| Nebraska | No |
| Nevada | No |
| New Hampshire | No |
| New Jersey | Yes |
| New Mexico | No |
| New York | No |
| North Carolina | No |
| North Dakota | Yes |
| Ohio | Yes |
| Oklahoma | Yes |
| Oregon | Yes |
| Pennsylvania | No |
| Rhode Island | No |
| South Carolina | Yes |
| South Dakota | Yes |
| Tennessee | Yes |
| Texas | No |
| Utah | Yes |
| Vermont | Yes |
| Virginia | Yes |
| Washington | No |
| West Virginia | No |
| Wisconsin | Yes |
| Wyoming | Yes |
One set of incomes; see method
Massachusetts's presumptive formula runs to $450,000; 12 schedules run higher, 28 stop lower.
Combined income at which each state's presumptive schedule ends; above it, support is discretionary.
- Ranked
- 41 combined-income schedules (29 gross, 11 net, 1 other basis)
- Not ranked
- 10: percentage-of-obligor, Melson or open formula
- Basis
- Annual; monthly ×12, weekly ×52
Forty-one jurisdictions have a combined-income schedule that stops at a stated figure: median $360,000, seven stop at exactly $40,000 a month, Utah's runs to $1.2 million. Ten use a percentage-of-obligor, Melson, or open formula with no combined ceiling. Net-income ceilings aren't dollar-for-dollar comparable with gross ones. Not ranked: Alaska, California, Delaware, Hawaii, Mississippi, Montana, Nevada, North Dakota, Texas, Wisconsin. This corrects an earlier comparison against nine benchmark states, where Massachusetts appeared second; among the 41 with a stated ceiling it is thirteenth.
Source: model/charts/fig9_ceilings.py ·
data (JSON) ·
data (CSV)
Full ranking behind E16: 41 combined-income schedules
| Rank | Jurisdiction | Combined-income ceiling | Basis |
|---|---|---|---|
| 1 | Utah | $1,200,000 | gross |
| 2 | Louisiana | $600,000 | gross |
| 3 | Washington | $600,000 | net |
| 4 | Virginia | $510,000 | gross |
| 5 | Colorado | $480,000 | gross |
| 6 | Georgia | $480,000 | gross |
| 7 | Missouri | $480,000 | gross |
| 8 | New Mexico | $480,000 | gross |
| 9 | North Carolina | $480,000 | gross |
| 10 | Rhode Island | $480,000 | gross |
| 11 | South Carolina | $480,000 | gross |
| 12 | Indiana | $478,400 | gross |
| 13 | Massachusetts, this page’s worked example | $450,000 | gross |
| 14 | Idaho | $440,000 | gross |
| 15 | West Virginia | $420,000 | gross |
| 16 | Maine | $400,000 | gross |
| 17 | New Hampshire | $373,068 | gross |
| 18 | Vermont | $360,300 | other |
| 19 | Alabama | $360,000 | gross |
| 20 | Arizona | $360,000 | gross |
| 21 | Arkansas | $360,000 | gross |
| 22 | Iowa | $360,000 | net |
| 23 | Kentucky | $360,000 | gross |
| 24 | Maryland | $360,000 | gross |
| 25 | Oregon | $360,000 | gross |
| 26 | Pennsylvania | $360,000 | net |
| 27 | South Dakota | $360,000 | net |
| 28 | Tennessee | $339,000 | gross |
| 29 | Ohio | $336,000 | gross |
| 30 | Illinois | $328,500 | net |
| 31 | Connecticut | $312,000 | net |
| 32 | District of Columbia | $240,000 | gross |
| 33 | Minnesota | $240,000 | gross |
| 34 | Nebraska | $240,000 | net |
| 35 | Kansas | $216,000 | gross |
| 36 | Michigan | $214,459 | net |
| 37 | New York | $193,000 | gross |
| 38 | New Jersey | $187,200 | net |
| 39 | Oklahoma | $180,000 | gross |
| 40 | Wyoming | $180,000 | net |
| 41 | Florida | $120,000 | net |
One set of incomes; see method
At primary custody, only Wisconsin and Hawaii order more than Massachusetts does at equal time.
Monthly order: Massachusetts under Box 1 (children half the time each) against every other jurisdiction with the children primarily with the lower earner.
- Custody
- MA equal time (Box 1) vs others primary
- Children
- 3
- Child care
- None (base support)
- Incomes
- $201,000 / $29,640
Only Hawaii and Wisconsin order more at primary custody than Massachusetts does at equal time. Massachusetts's own primary-custody order, $4,714, is marked for scale and isn't part of the ranked comparison. The Commonwealth's consultant attributes the higher amounts to cost of living, which bears on both households; whatever it explains about the level, it doesn't explain why an arrangement giving each parent half the time is priced where sole primary custody is priced almost everywhere else. One worked example; Georgia held out (see E11).
Source: model/charts/fig10_ma_shared_vs_primary.py ·
data (JSON) ·
data (CSV)
Full ranking behind E17: Massachusetts vs. 49 other jurisdictions' primary-custody orders
| Rank | Jurisdiction | Custody basis | Monthly order |
|---|---|---|---|
| 1 | Hawaii | Primary, lower earner | $5,821.00 |
| — | Massachusetts, this page’s worked example | Primary (Box 2) — for scale, not ranked | $4,714.22 |
| 2 | Wisconsin | Primary, lower earner | $4,491.71 |
| 3 | Massachusetts, this page’s worked example | Equal time (Box 1) | $4,388.48 |
| 4 | New York | Primary, lower earner | $4,067.61 |
| 5 | Delaware | Primary, lower earner | $3,990.73 |
| 6 | New Hampshire | Primary, lower earner | $3,838.66 |
| 7 | Kansas | Primary, lower earner | $3,838.03 |
| 8 | Iowa | Primary, lower earner | $3,744.73 |
| 9 | Texas | Primary, lower earner | $3,510.00 |
| 10 | District of Columbia | Primary, lower earner | $3,467.96 |
| 11 | Alaska | Primary, lower earner | $3,462.96 |
| 12 | California | Primary, lower earner | $3,436.04 |
| 13 | Maryland | Primary, lower earner | $3,295.11 |
| 14 | Louisiana | Primary, lower earner | $3,269.06 |
| 15 | North Dakota | Primary, lower earner | $3,219.00 |
| 16 | Missouri | Primary, lower earner | $3,139.00 |
| 17 | Connecticut | Primary, lower earner | $3,138.20 |
| 18 | Rhode Island | Primary, lower earner | $3,123.22 |
| 19 | Colorado | Primary, lower earner | $3,090.30 |
| 20 | Pennsylvania | Primary, lower earner | $3,086.76 |
| 21 | Montana | Primary, lower earner | $3,073.50 |
| 22 | Illinois | Primary, lower earner | $3,037.90 |
| 23 | New Jersey | Primary, lower earner | $3,002.31 |
| 24 | North Carolina | Primary, lower earner | $2,934.30 |
| 25 | Maine | Primary, lower earner | $2,899.02 |
| 26 | Washington | Primary, lower earner | $2,819.56 |
| 27 | Michigan | Primary, lower earner | $2,808.44 |
| 28 | Wyoming | Primary, lower earner | $2,801.97 |
| 29 | New Mexico | Primary, lower earner | $2,795.32 |
| 30 | Alabama | Primary, lower earner | $2,736.00 |
| 31 | Virginia | Primary, lower earner | $2,672.09 |
| 32 | South Carolina | Primary, lower earner | $2,669.21 |
| 33 | South Dakota | Primary, lower earner | $2,623.12 |
| 34 | Vermont | Primary, lower earner | $2,594.42 |
| 35 | Mississippi | Primary, lower earner | $2,564.76 |
| 36 | Ohio | Primary, lower earner | $2,564.15 |
| 37 | Idaho | Primary, lower earner | $2,549.85 |
| 38 | Indiana | Primary, lower earner | $2,548.03 |
| 39 | West Virginia | Primary, lower earner | $2,518.77 |
| 40 | Florida | Primary, lower earner | $2,512.99 |
| 41 | Nevada | Primary, lower earner | $2,485.00 |
| 42 | Nebraska | Primary, lower earner | $2,402.03 |
| 43 | Arkansas | Primary, lower earner | $2,349.64 |
| 44 | Utah | Primary, lower earner | $2,332.66 |
| 45 | Arizona | Primary, lower earner | $2,290.06 |
| 46 | Minnesota | Primary, lower earner | $2,271.30 |
| 47 | Tennessee | Primary, lower earner | $2,031.00 |
| 48 | Oklahoma | Primary, lower earner | $2,008.78 |
| 49 | Kentucky | Primary, lower earner | $1,871.67 |
| 50 | Oregon | Primary, lower earner | $1,772.00 |
The cost-of-living defence, tested on its own page:
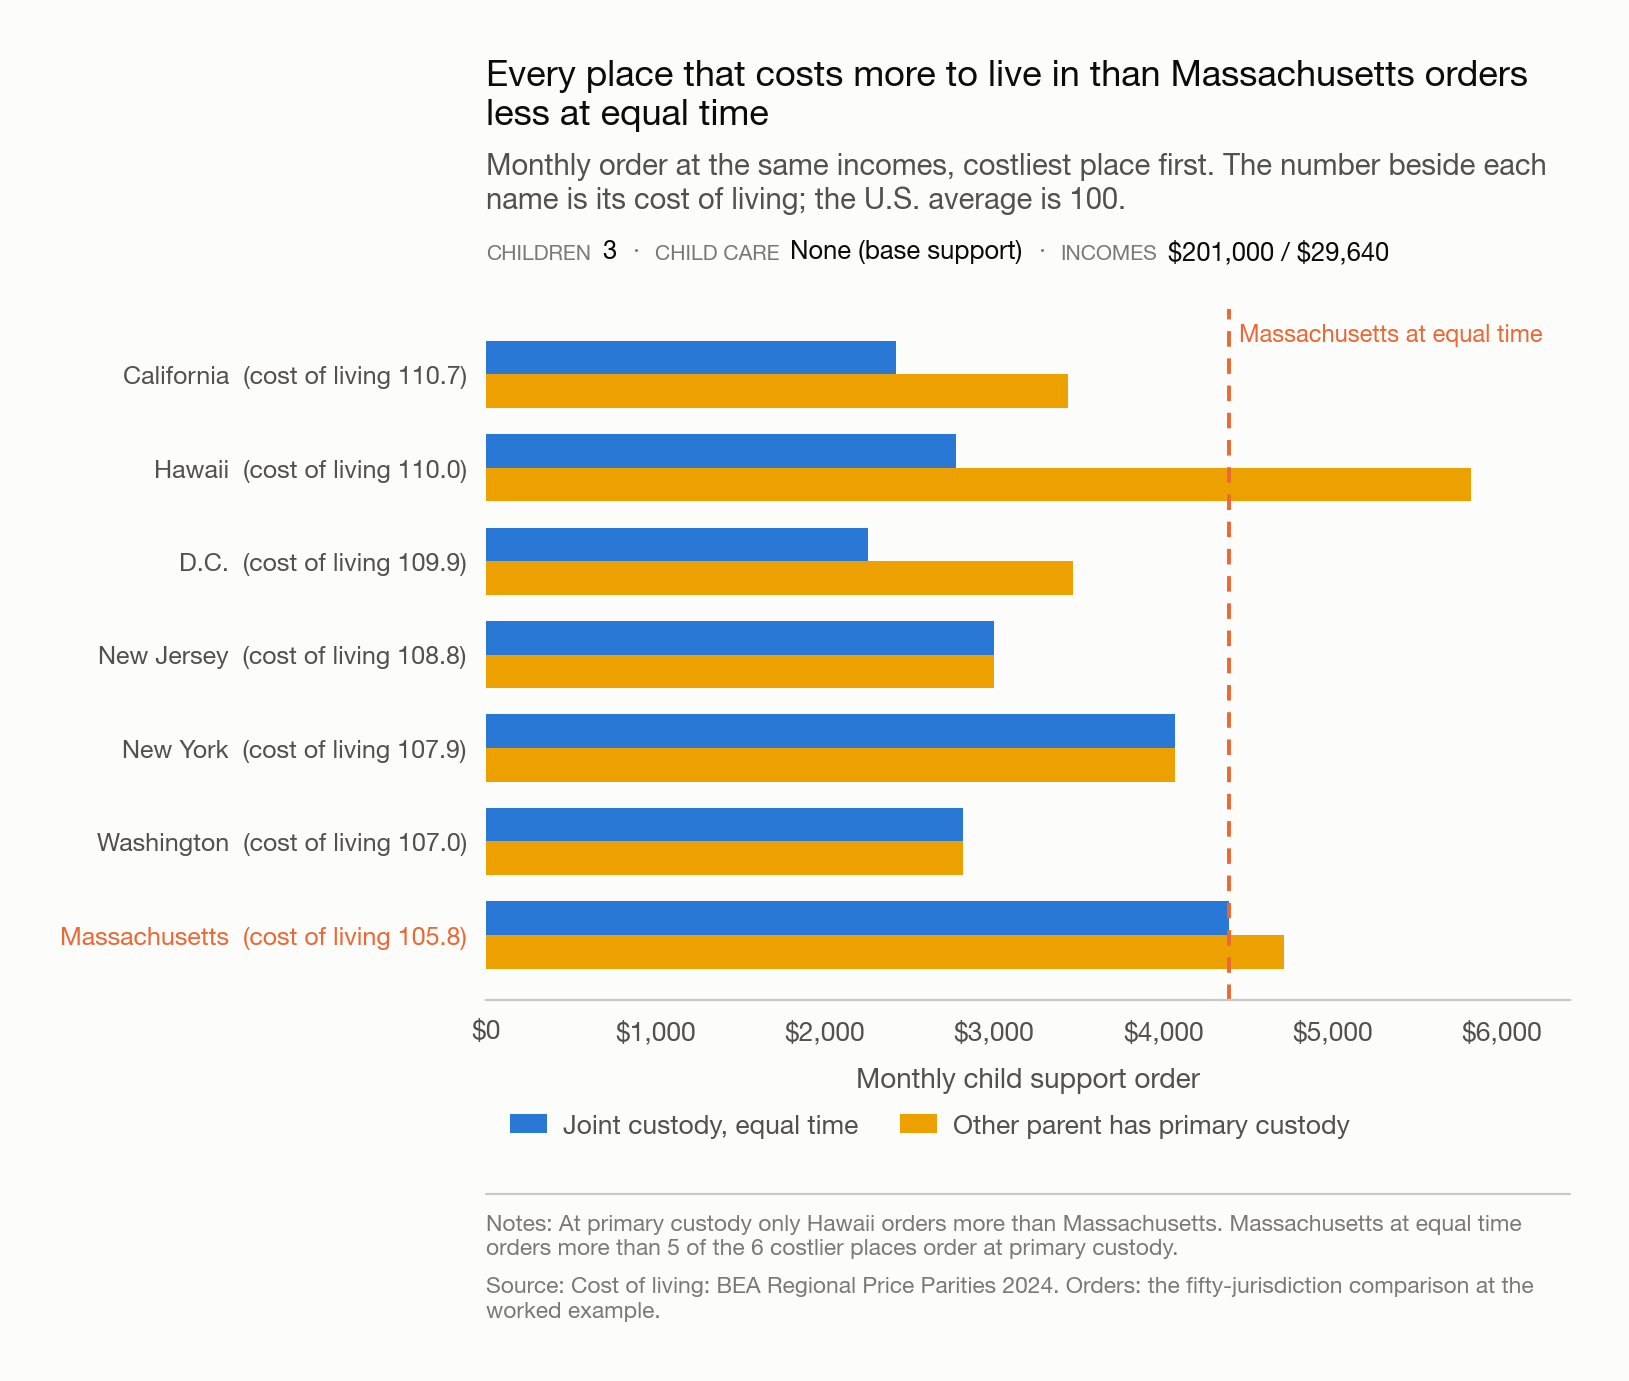
Every place that costs more to live in than Massachusetts orders less at equal time.
Monthly order at the same incomes, costliest place first, at equal time and at primary custody.
Cost of living: BEA Regional Price Parities 2024, all items, U.S. average 100.
Source: model/cost_of_living.py ·
data (CSV)
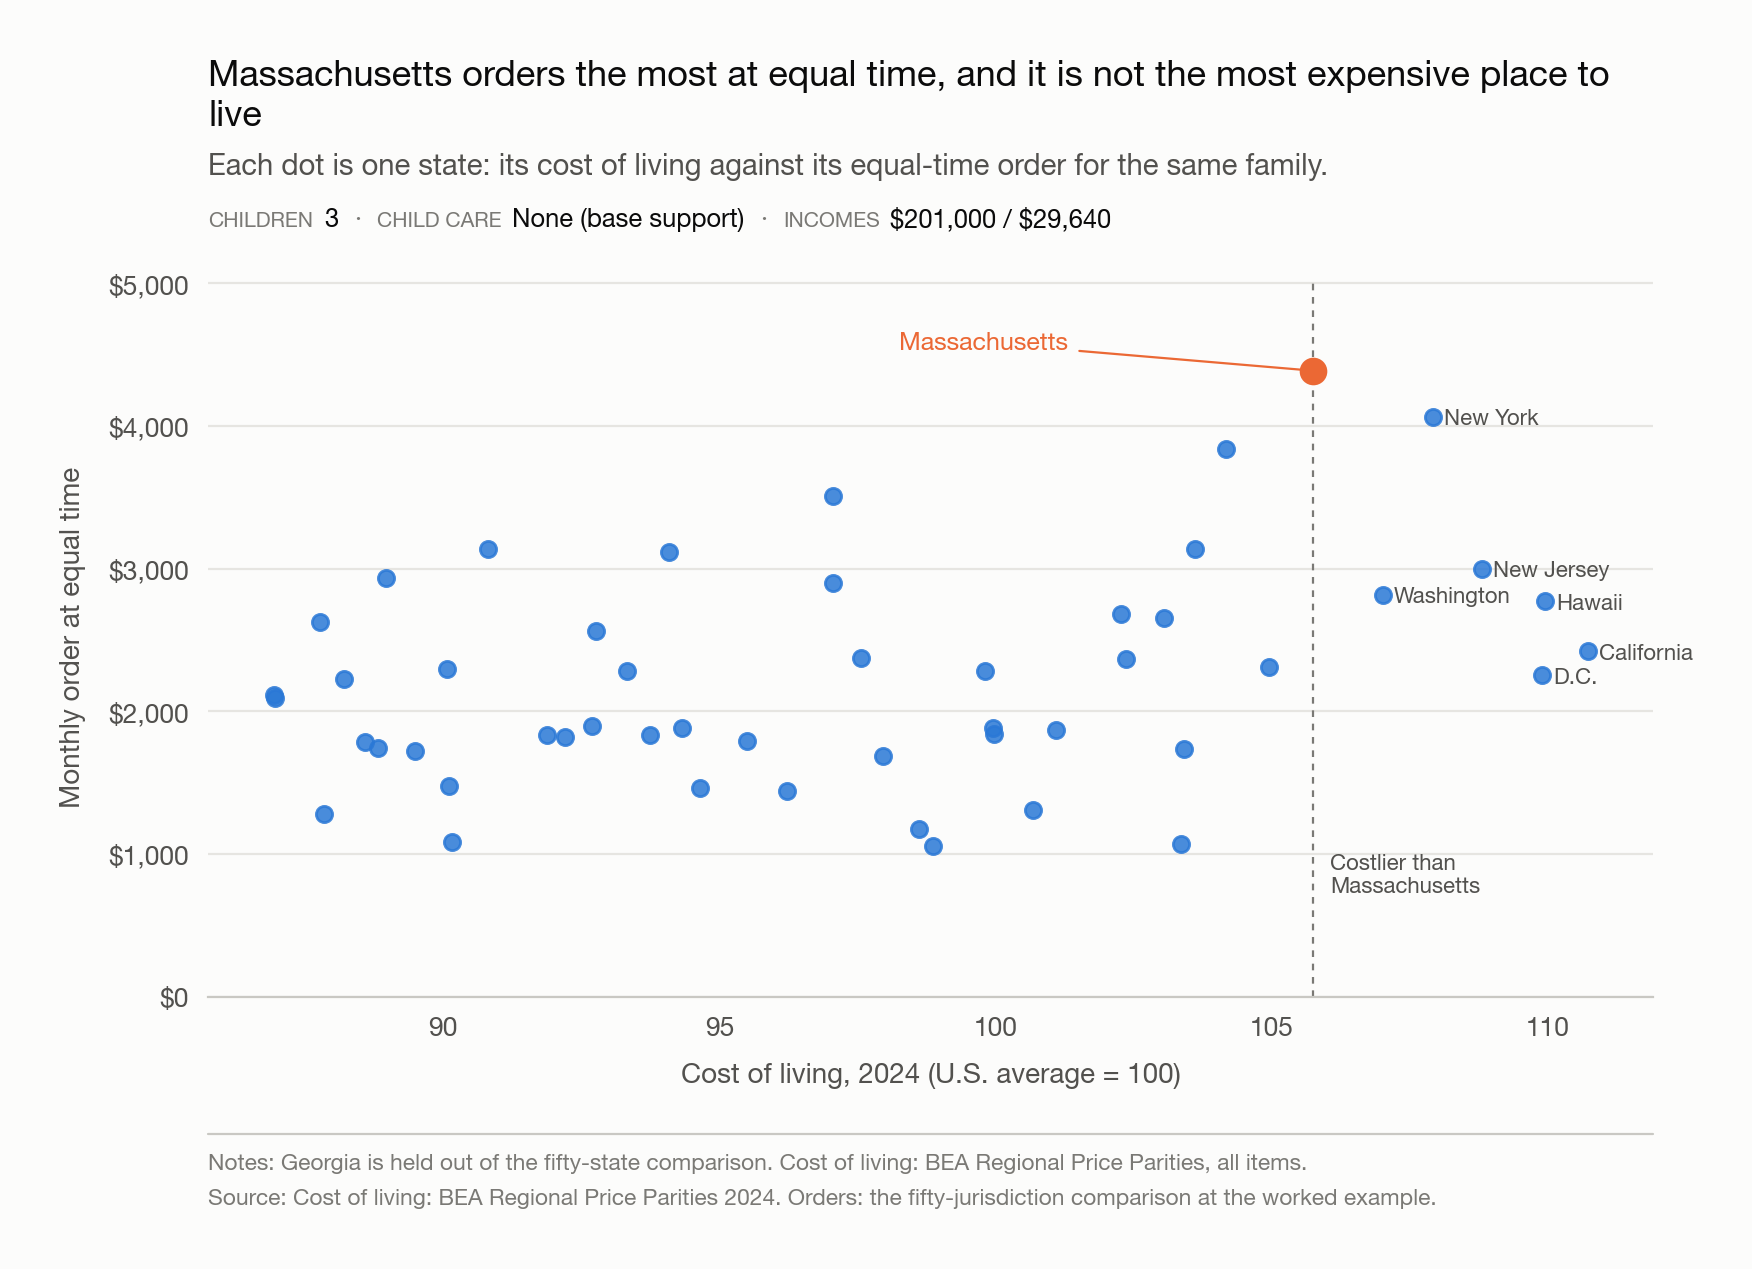
Massachusetts orders the most at equal time, and it is not the most expensive place to live.
Each dot is one state: its cost of living against its equal-time order for the same family.
Georgia is held out of the fifty-state comparison.
Source: model/cost_of_living.py ·
data (CSV)
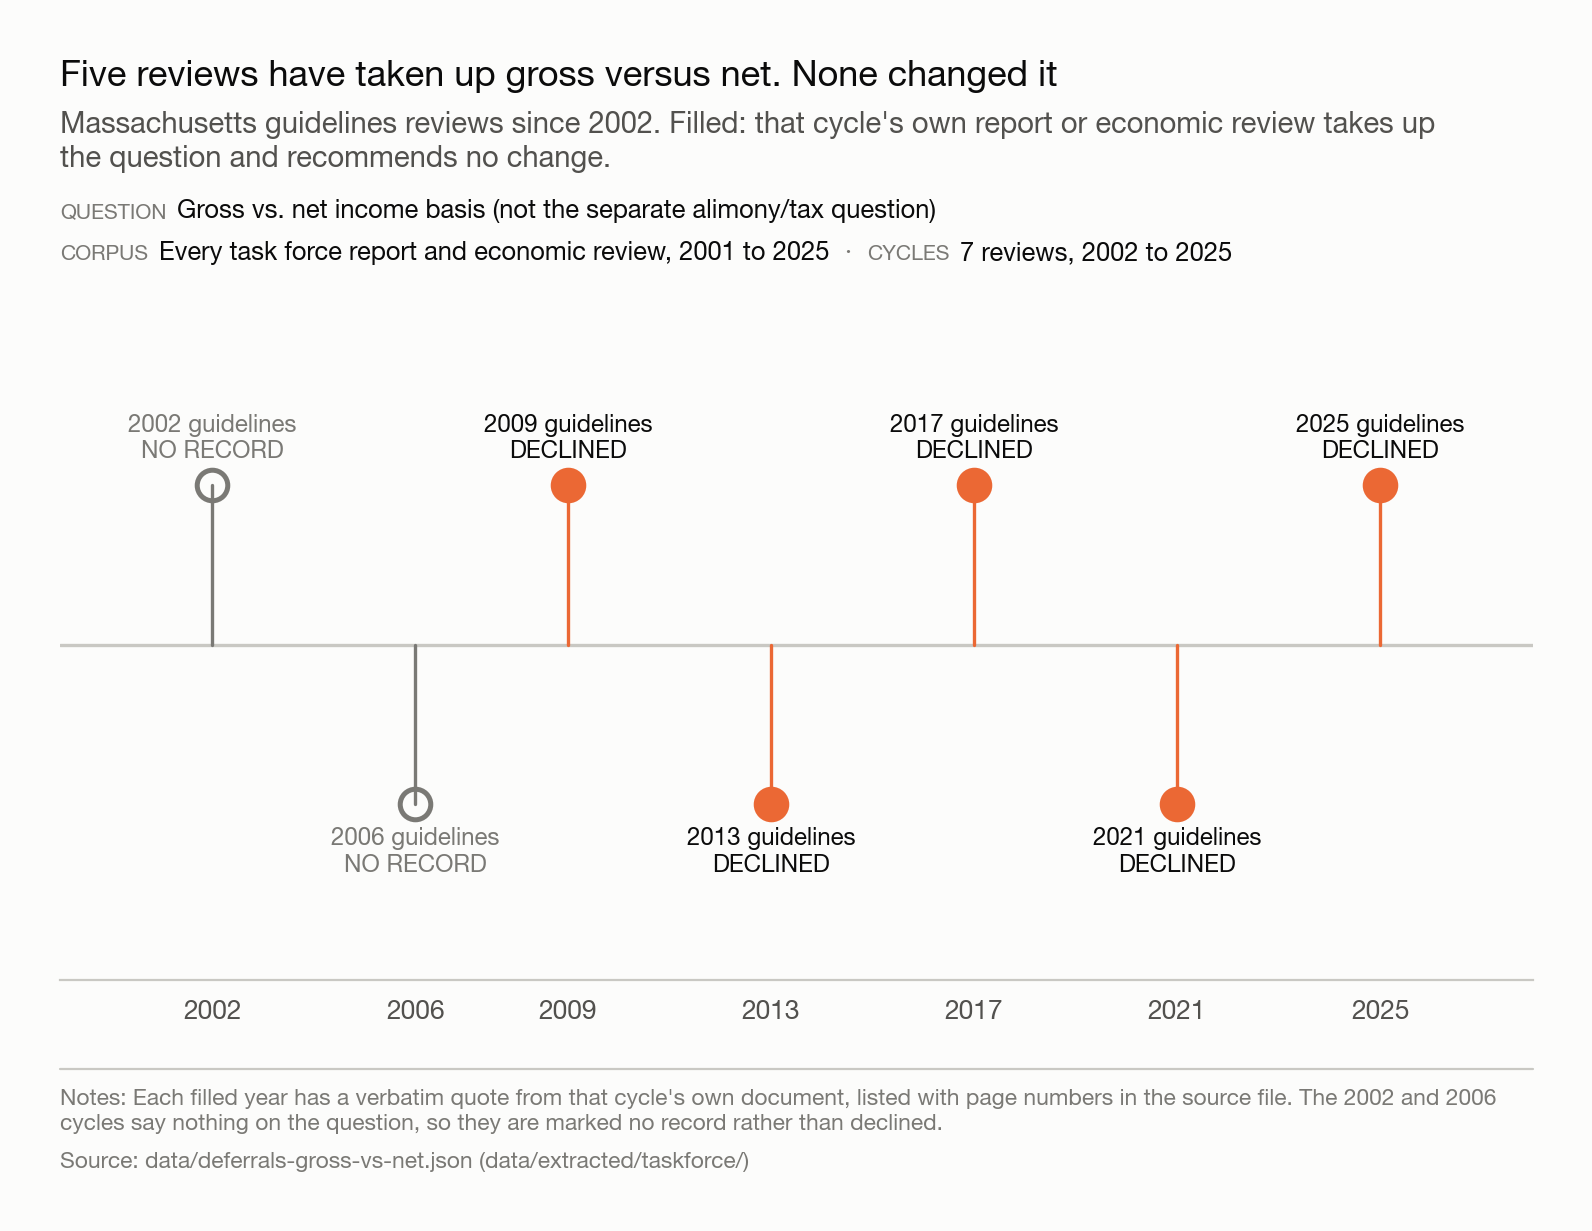
Five reviews have raised gross versus net, and none has changed it
Documentary: built only from primary-text quotes
Five reviews have taken up gross versus net. None changed it.
Massachusetts guidelines reviews since 2002. Filled: the cycle's own report or economic review declines the change.
- Question
- Gross vs. net income basis (not the separate alimony/tax question)
- Corpus
- Every task force report and economic review, 2001 to 2025
- Cycles
- 7 reviews, 2002 to 2025
Every filled year carries a verbatim quote from that cycle's own report or economic review, with page numbers in the source file. The 2009 Task Force found "little support ... for basing orders on net income"; the 2012 Task Force "declines to recommend this change." The 2002 and 2006 cycles say nothing on the question.
Source: model/charts/fig11_deferral_timeline.py ·
data (JSON) ·
data (CSV)
Check any of these yourself
Every figure above is drawn by a script under model/charts/ from the models and
datasets linked from its own Source line. Rebuild the whole set with
model/charts/make_all.py, then the exhibit crop with
model/charts/exhibits.py; every PNG has a CSV or dataset beside it holding the values
actually plotted.