
The fifty-state comparison
Massachusetts orders the most of fifty jurisdictions at equal parenting time
At the one worked example tested, Massachusetts's equal-parenting order ranks first of fifty. Each state's amount was worked out from its own guidelines, twice, and the two results were compared and checked for errors.
This is the weakest claim on this site. It rests on a single worked example and generalizes to nothing beyond it.
Massachusetts's rank on the equal-parenting-time order, one worked example: three children, $201,000 and $29,640 a year, no child care
See method below. One worked example; the ranking generalizes to nothing else.
The worked example run through all fifty-one jurisdictions on this page is fixed: three children, a payor at $201,000 a year, the other parent at $29,640 a year ($570 a week), no child care claimed. I pay child support in Massachusetts myself, so I have a stake in the outcome; the ranking below only means what it says if the reader can see exactly what was held fixed.
The data behind every figure on this page is described on the data page, which links each of the underlying files directly.
Fifty of fifty-one jurisdictions passed every check. Georgia did not, and carries no number here
Each of the fifty states and the District of Columbia was worked out from its own guidelines, twice and separately. Where the two results disagreed, the difference was traced and fixed, and every result was then checked again for errors. Fifty of fifty-one passed. Georgia is the one held out: its enacted formula and its own online calculator both produce a lower order at primary custody than at equal time, an inversion this analysis could not resolve into one trustworthy number, so Georgia is left off every ranking instead of assigned a number that could be wrong.
That leaves fifty jurisdictions ranked, at one set of incomes. Change the income level, the custody split, or the number of children, and every ranking below could move, in either direction.
At equal parenting time, Massachusetts’s order is the highest of the fifty jurisdictions modeled
$4,388 a month Massachusetts's Box 1 (equal parenting time) order at the worked example: $321 more than New York, the next-highest of the fifty jurisdictions modeled
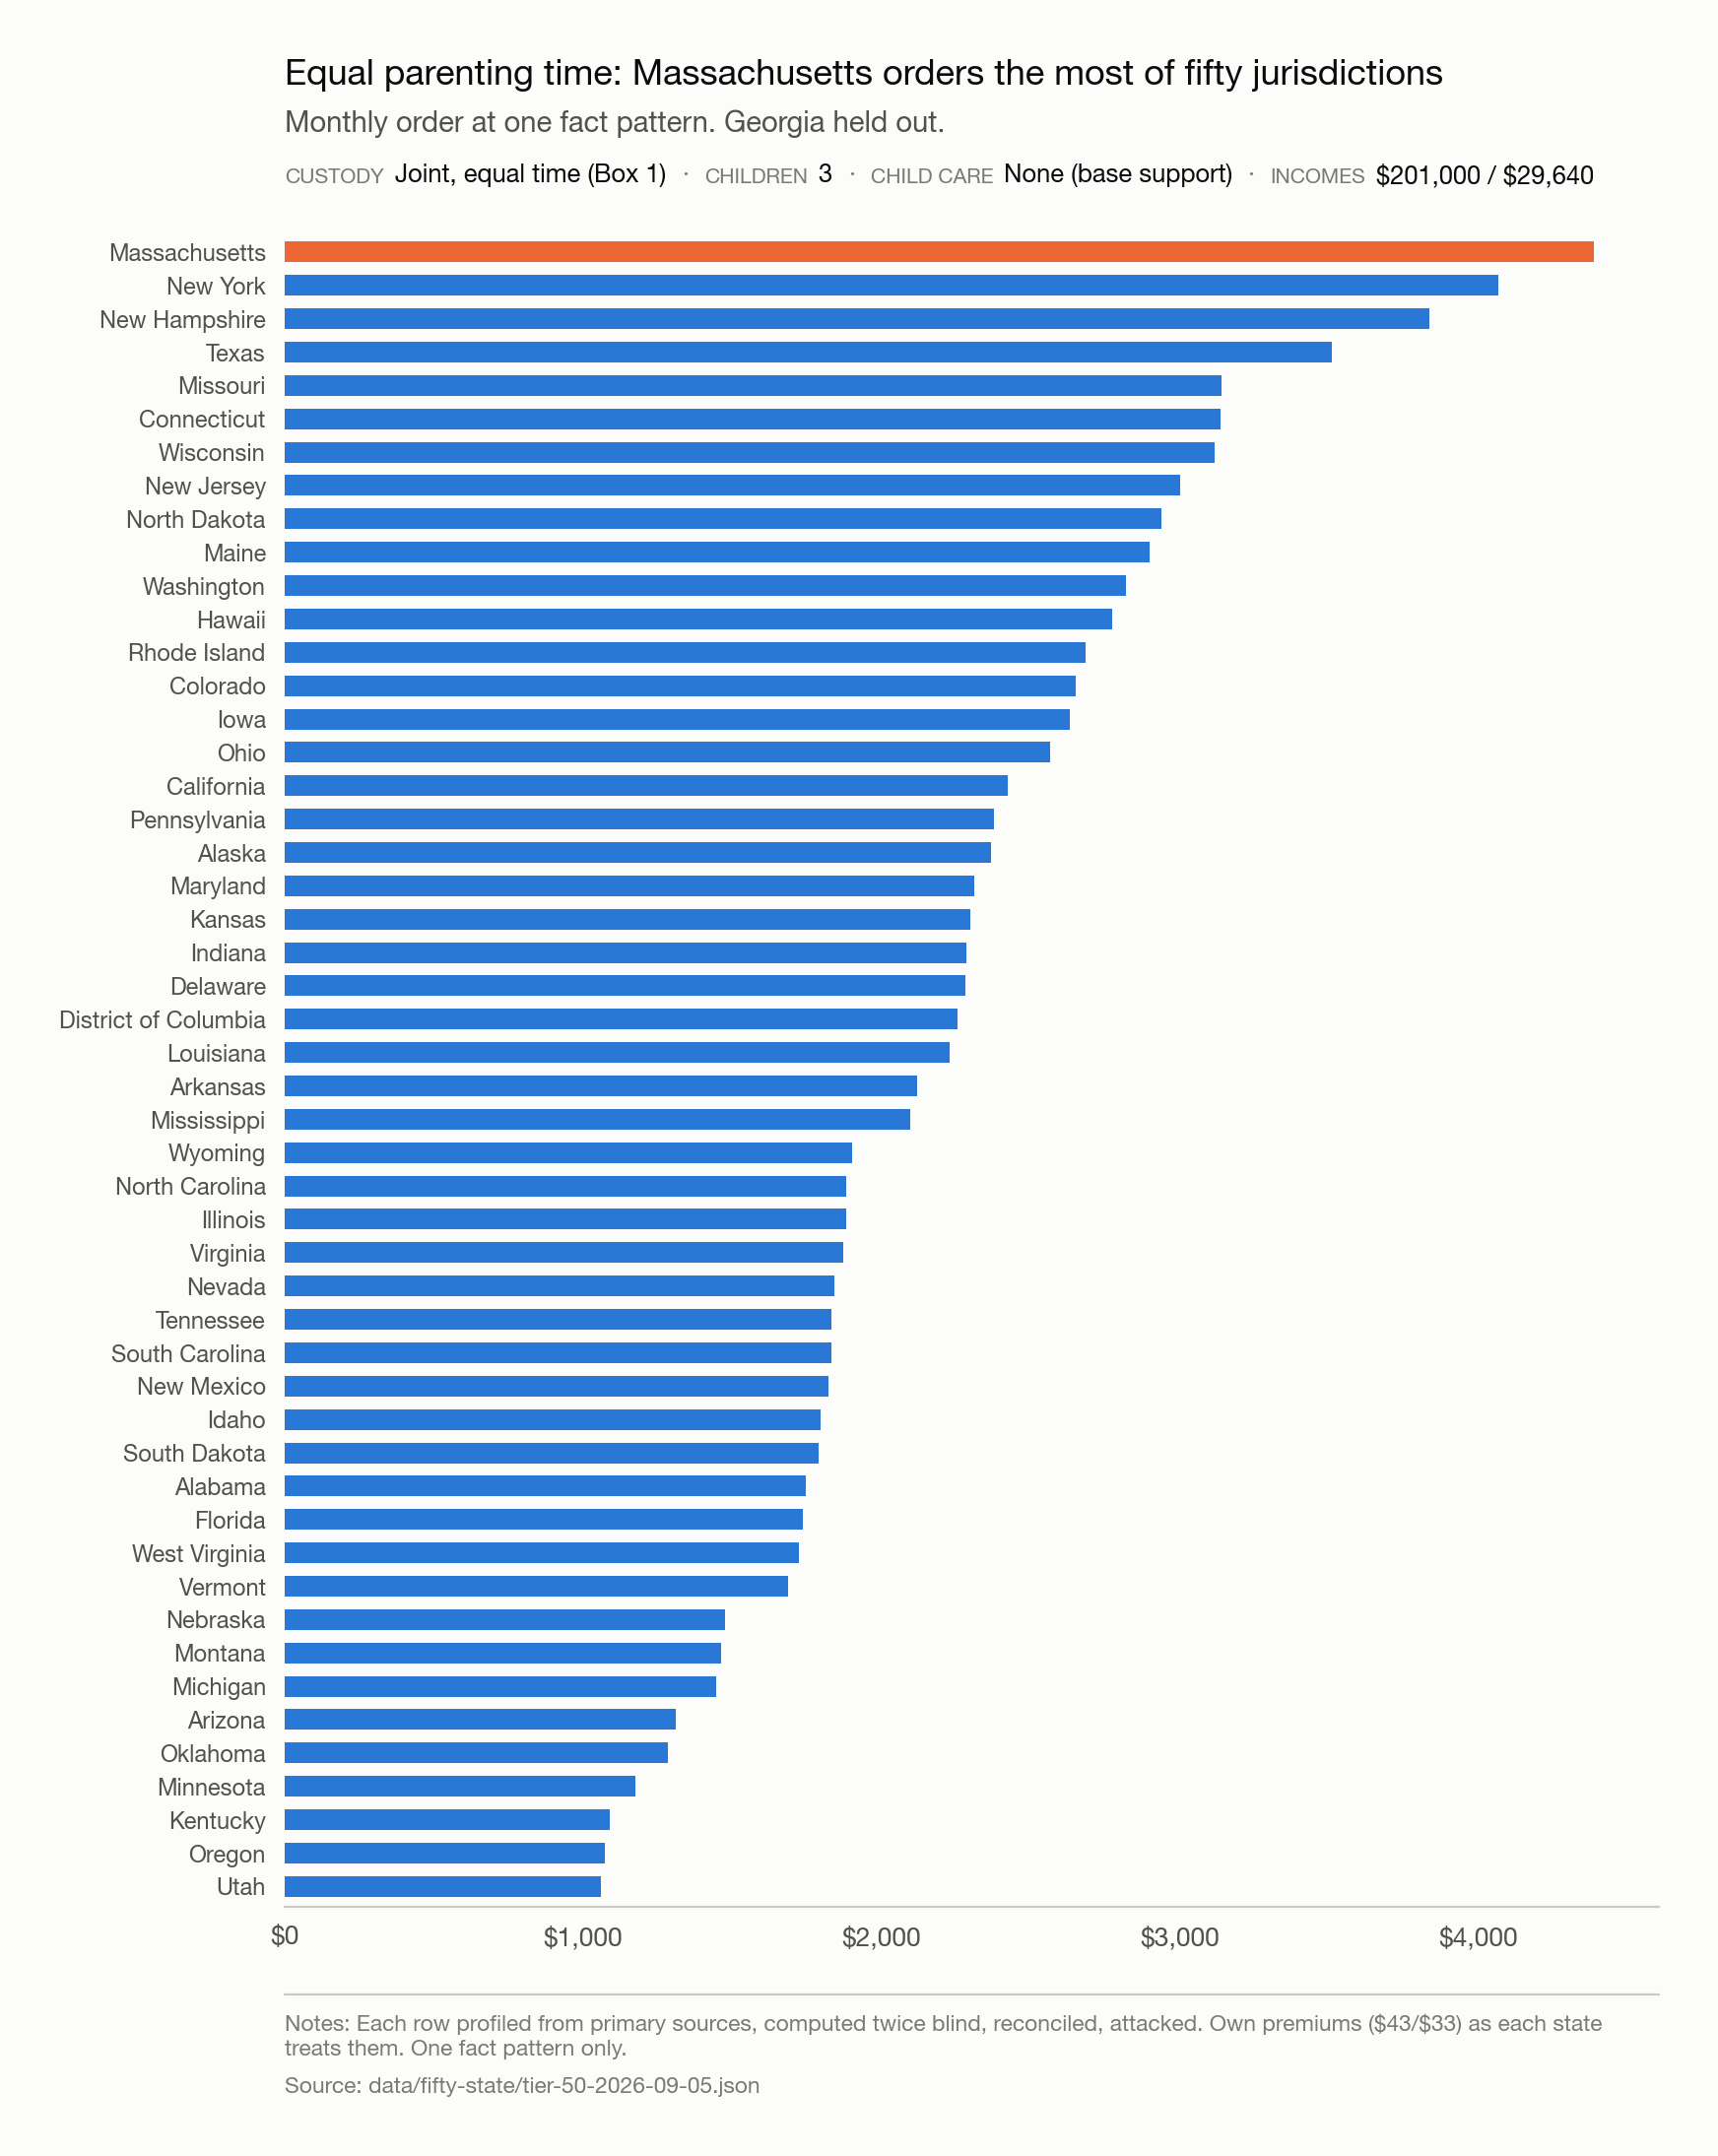
At equal parenting time, Massachusetts orders the most of the fifty states.
Monthly order at one set of incomes, three children, $201,000 and $29,640, no child care.
Georgia is held out; see method, above. One worked example; the ranking generalizes to nothing else.
Source: model/charts/fig5_states.py ·
data (JSON) ·
data (CSV)
Method: the full fifty-jurisdiction ranking, equal parenting time
| Rank | Jurisdiction | Monthly order |
|---|---|---|
| 1 | Massachusetts, this page’s worked example | $4,388.48 |
| 2 | New York | $4,067.61 |
| 3 | New Hampshire | $3,838.66 |
| 4 | Texas | $3,510.00 |
| 5 | Missouri | $3,139.00 |
| 6 | Connecticut | $3,138.20 |
| 7 | Wisconsin | $3,117.35 |
| 8 | New Jersey | $3,002.31 |
| 9 | North Dakota | $2,939.00 |
| 10 | Maine | $2,899.02 |
| 11 | Washington | $2,819.56 |
| 12 | Hawaii | $2,774.00 |
| 13 | Rhode Island | $2,684.45 |
| 14 | Colorado | $2,652.32 |
| 15 | Iowa | $2,630.25 |
| 16 | Ohio | $2,564.15 |
| 17 | California | $2,424.32 |
| 18 | Pennsylvania | $2,378.42 |
| 19 | Alaska | $2,367.95 |
| 20 | Maryland | $2,309.54 |
| 21 | Kansas | $2,296.63 |
| 22 | Indiana | $2,283.25 |
| 23 | Delaware | $2,281.35 |
| 24 | District of Columbia | $2,253.73 |
| 25 | Louisiana | $2,227.23 |
| 26 | Arkansas | $2,118.68 |
| 27 | Mississippi | $2,097.44 |
| 28 | Wyoming | $1,900.85 |
| 29 | North Carolina | $1,883.12 |
| 30 | Illinois | $1,881.45 |
| 31 | Virginia | $1,872.18 |
| 32 | Nevada | $1,842.80 |
| 33 | Tennessee | $1,833.00 |
| 34 | South Carolina | $1,832.22 |
| 35 | New Mexico | $1,823.64 |
| 36 | Idaho | $1,794.22 |
| 37 | South Dakota | $1,788.96 |
| 38 | Alabama | $1,746.00 |
| 39 | Florida | $1,735.21 |
| 40 | West Virginia | $1,724.21 |
| 41 | Vermont | $1,686.42 |
| 42 | Nebraska | $1,475.23 |
| 43 | Montana | $1,461.00 |
| 44 | Michigan | $1,445.25 |
| 45 | Arizona | $1,309.36 |
| 46 | Oklahoma | $1,284.42 |
| 47 | Minnesota | $1,174.71 |
| 48 | Kentucky | $1,087.80 |
| 49 | Oregon | $1,072.00 |
| 50 | Utah | $1,058.31 |
With the children primarily with the lower earner, only Hawaii’s order is higher
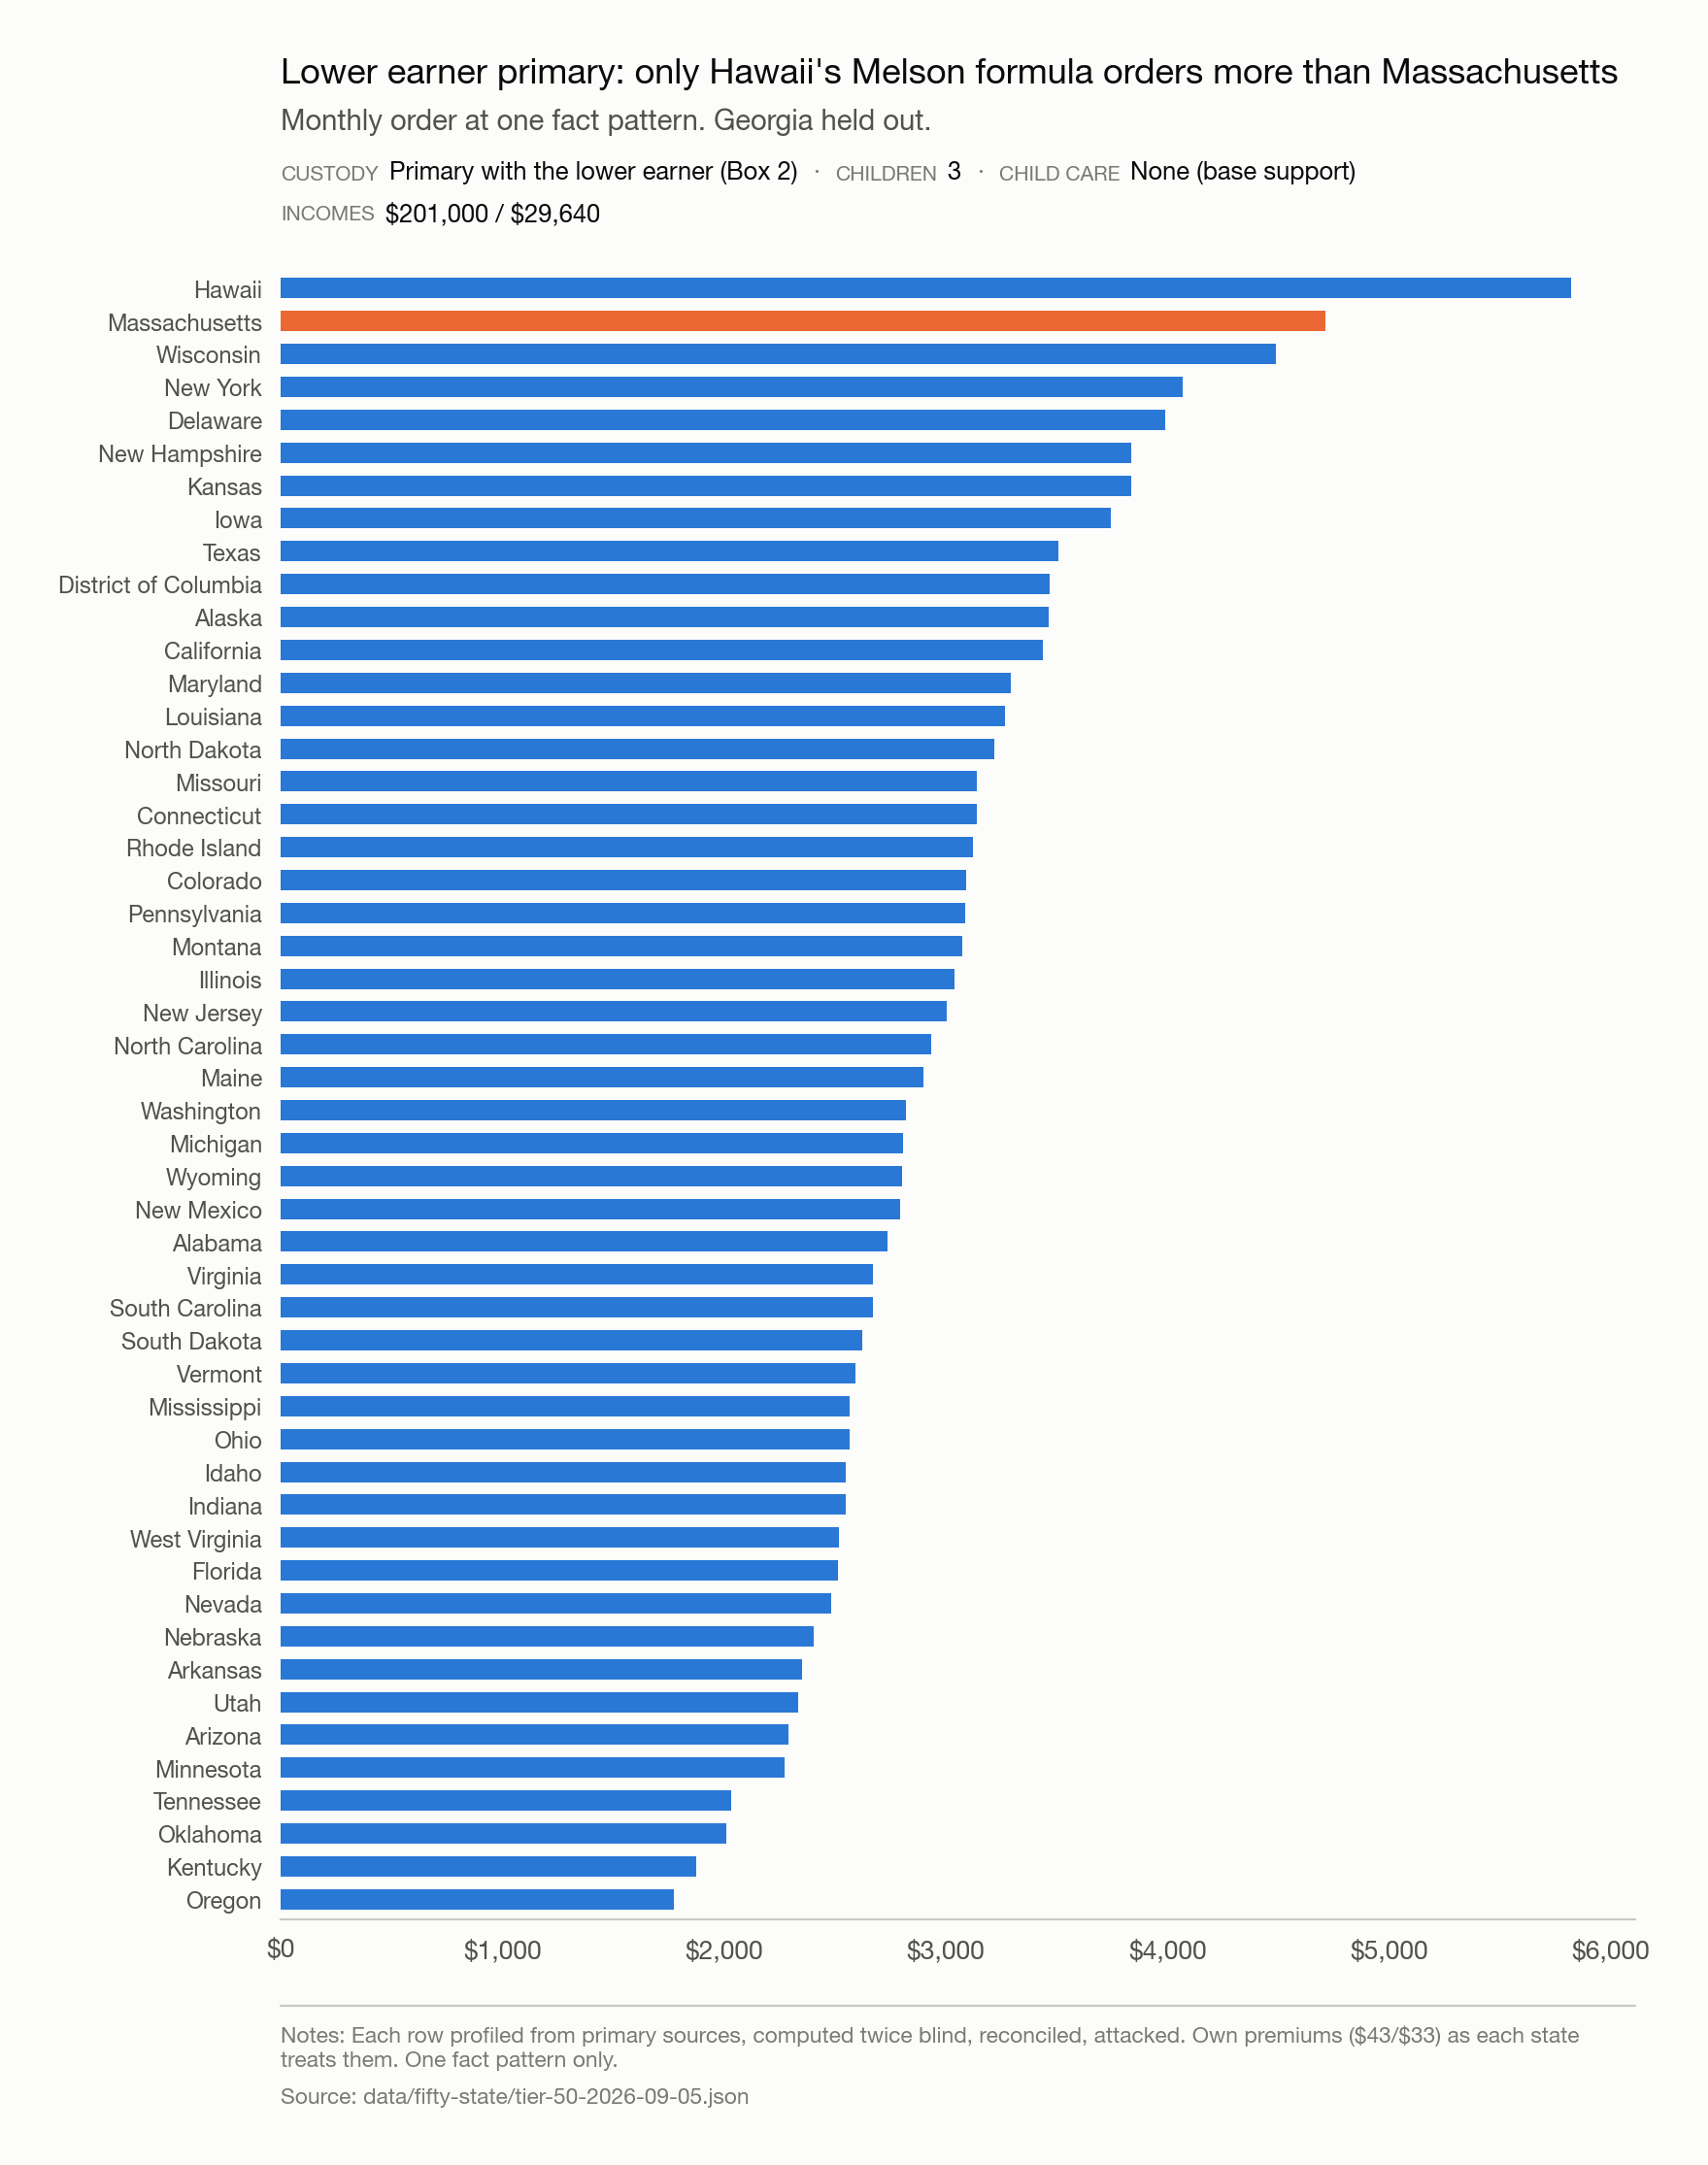
With the lower earner primary, only Hawaii orders more than Massachusetts.
The same family with the children primarily with the lower earner.
Hawaii's design is shared with Delaware and Montana; at this income gap it exhausts the self-support reserve (the income floor a worksheet protects for the payor) differently from an income-shares schedule (the combined-income method most states, including Massachusetts, use).
Source: model/charts/fig5_states.py ·
data (JSON) ·
data (CSV)
Method: the full fifty-jurisdiction ranking, lower earner primary
| Rank | Jurisdiction | Monthly order |
|---|---|---|
| 1 | Hawaii | $5,821.00 |
| 2 | Massachusetts, this page’s worked example | $4,714.22 |
| 3 | Wisconsin | $4,491.71 |
| 4 | New York | $4,067.61 |
| 5 | Delaware | $3,990.73 |
| 6 | New Hampshire | $3,838.66 |
| 7 | Kansas | $3,838.03 |
| 8 | Iowa | $3,744.73 |
| 9 | Texas | $3,510.00 |
| 10 | District of Columbia | $3,467.96 |
| 11 | Alaska | $3,462.96 |
| 12 | California | $3,436.04 |
| 13 | Maryland | $3,295.11 |
| 14 | Louisiana | $3,269.06 |
| 15 | North Dakota | $3,219.00 |
| 16 | Missouri | $3,139.00 |
| 17 | Connecticut | $3,138.20 |
| 18 | Rhode Island | $3,123.22 |
| 19 | Colorado | $3,090.30 |
| 20 | Pennsylvania | $3,086.76 |
| 21 | Montana | $3,073.50 |
| 22 | Illinois | $3,037.90 |
| 23 | New Jersey | $3,002.31 |
| 24 | North Carolina | $2,934.30 |
| 25 | Maine | $2,899.02 |
| 26 | Washington | $2,819.56 |
| 27 | Michigan | $2,808.44 |
| 28 | Wyoming | $2,801.97 |
| 29 | New Mexico | $2,795.32 |
| 30 | Alabama | $2,736.00 |
| 31 | Virginia | $2,672.09 |
| 32 | South Carolina | $2,669.21 |
| 33 | South Dakota | $2,623.12 |
| 34 | Vermont | $2,594.42 |
| 35 | Mississippi | $2,564.76 |
| 36 | Ohio | $2,564.15 |
| 37 | Idaho | $2,549.85 |
| 38 | Indiana | $2,548.03 |
| 39 | West Virginia | $2,518.77 |
| 40 | Florida | $2,512.99 |
| 41 | Nevada | $2,485.00 |
| 42 | Nebraska | $2,402.03 |
| 43 | Arkansas | $2,349.64 |
| 44 | Utah | $2,332.66 |
| 45 | Arizona | $2,290.06 |
| 46 | Minnesota | $2,271.30 |
| 47 | Tennessee | $2,031.00 |
| 48 | Oklahoma | $2,008.78 |
| 49 | Kentucky | $1,871.67 |
| 50 | Oregon | $1,772.00 |
In Massachusetts and 22 other states, having the children a third of the time lowers the order by nothing.
Massachusetts’s primary-custody box already assumes the paying parent has the children about a third of the time and gives nothing for it: the order is the same as for a parent with no overnights.
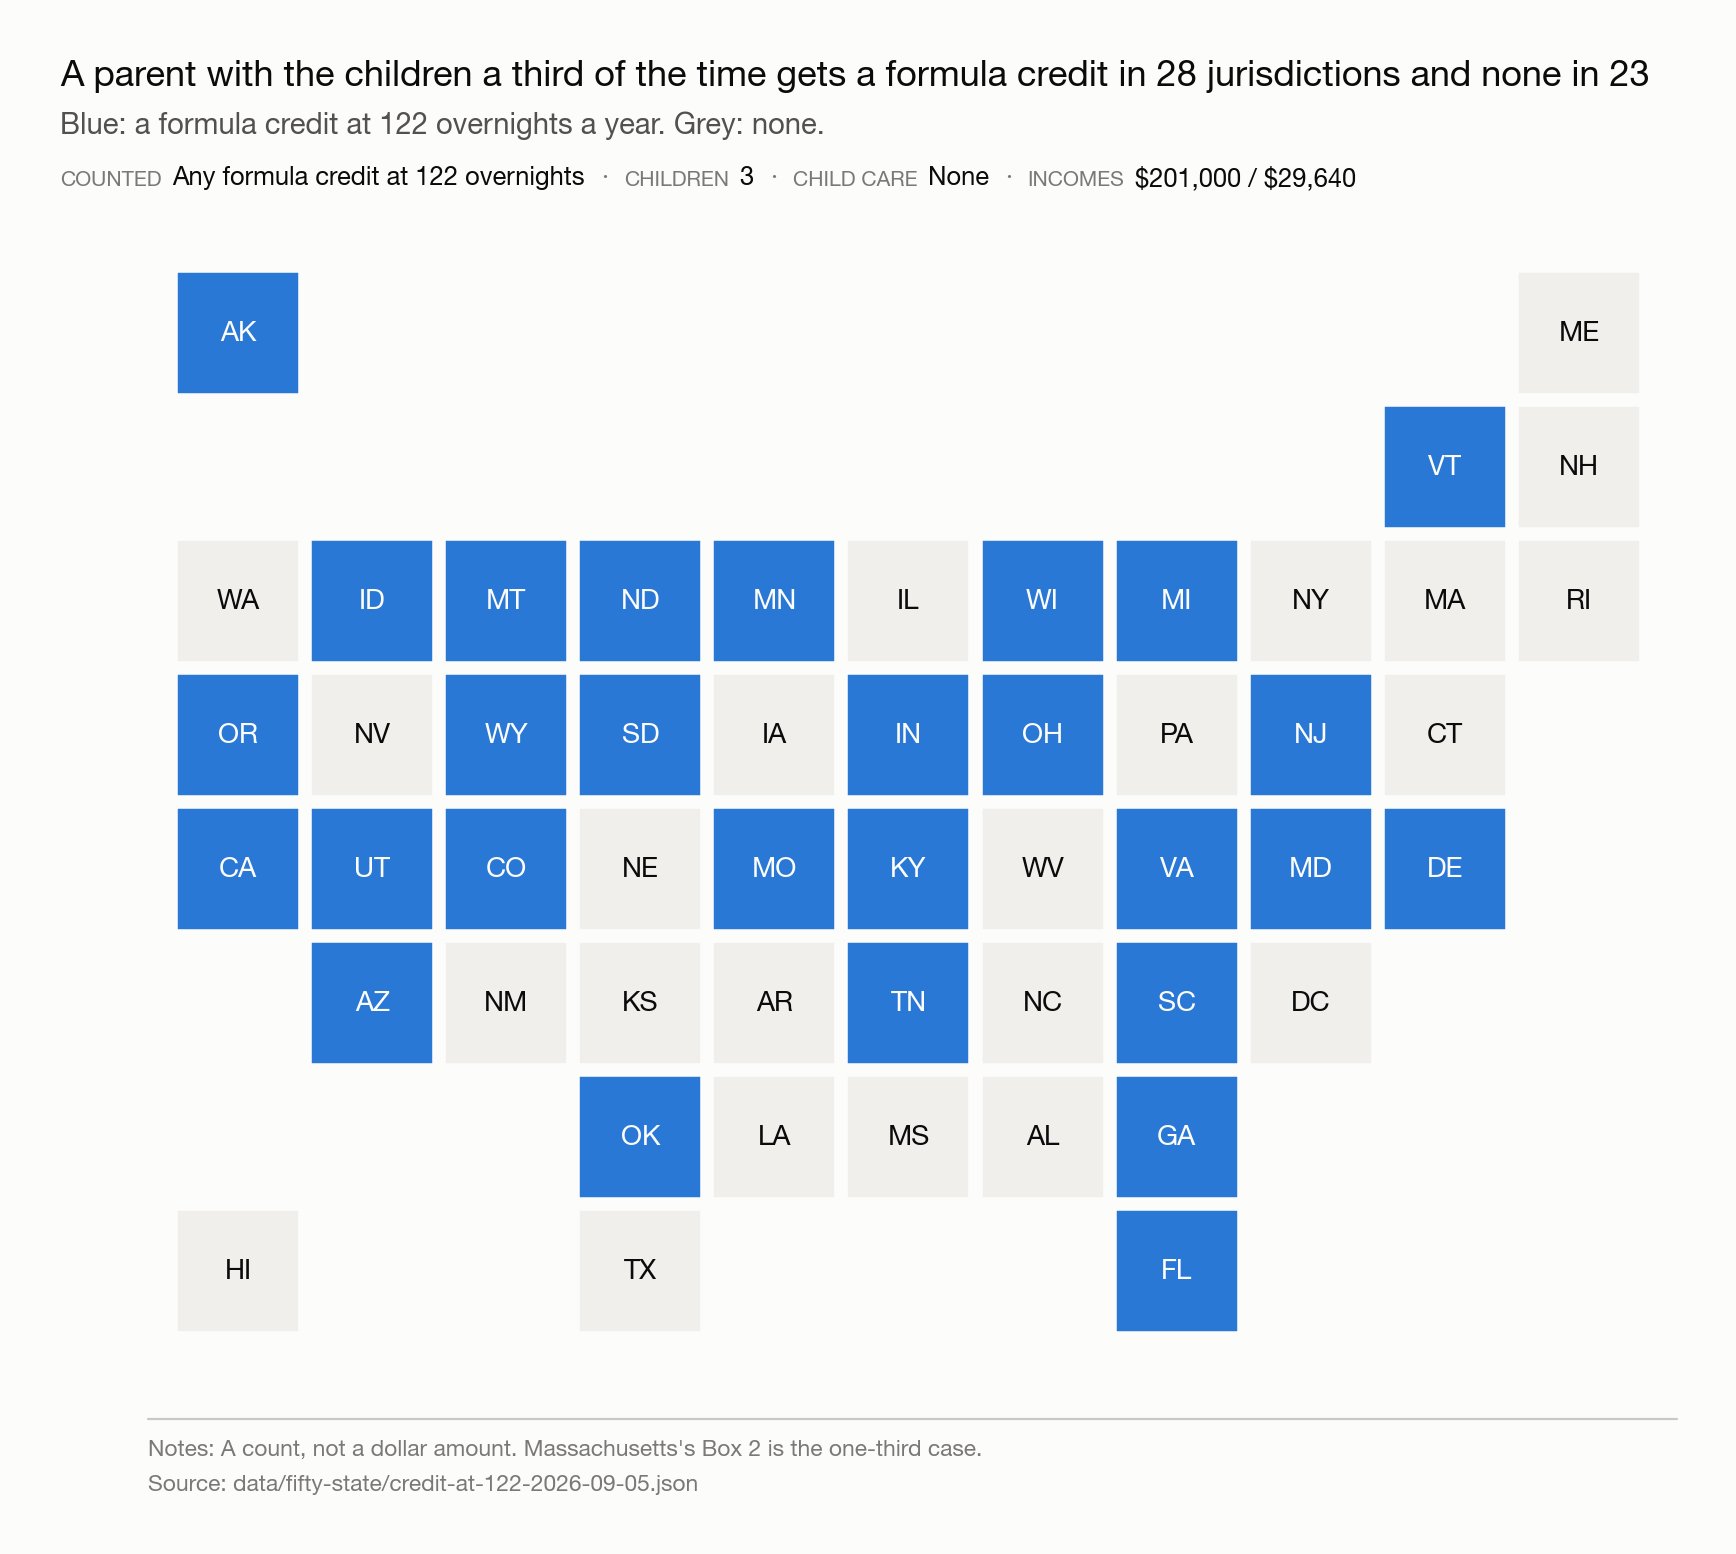
In Massachusetts and 22 other states, having the children a third of the time lowers the order by nothing.
Twenty-eight states give that parent a formula credit; 23 do not. A count, not a dollar amount.
In the one clean pairing with a credit-giving state the dollar effect runs the other way, so the count is a structural fact and nothing more.
Source: data (JSON)
Massachusetts keeps its formula running past the income where most states hand the decision to a judge
This is a ceiling on income, not a ceiling on support. Most states stop applying their formula once the parents’ combined income passes a stated figure. Above it a judge decides the amount instead of the schedule. Nothing here caps what anyone pays.
Massachusetts runs its formula up to $450,000 of combined parental income. That is the 13th highest income ceiling among the 41 states that set one, so most of them stop before Massachusetts does, and a family whose income they would leave to a judge is still inside the formula here. Ten states set no income ceiling at all, so their formula never stops.
This corrects an earlier comparison this project made against nine benchmark states, where Massachusetts appeared second.
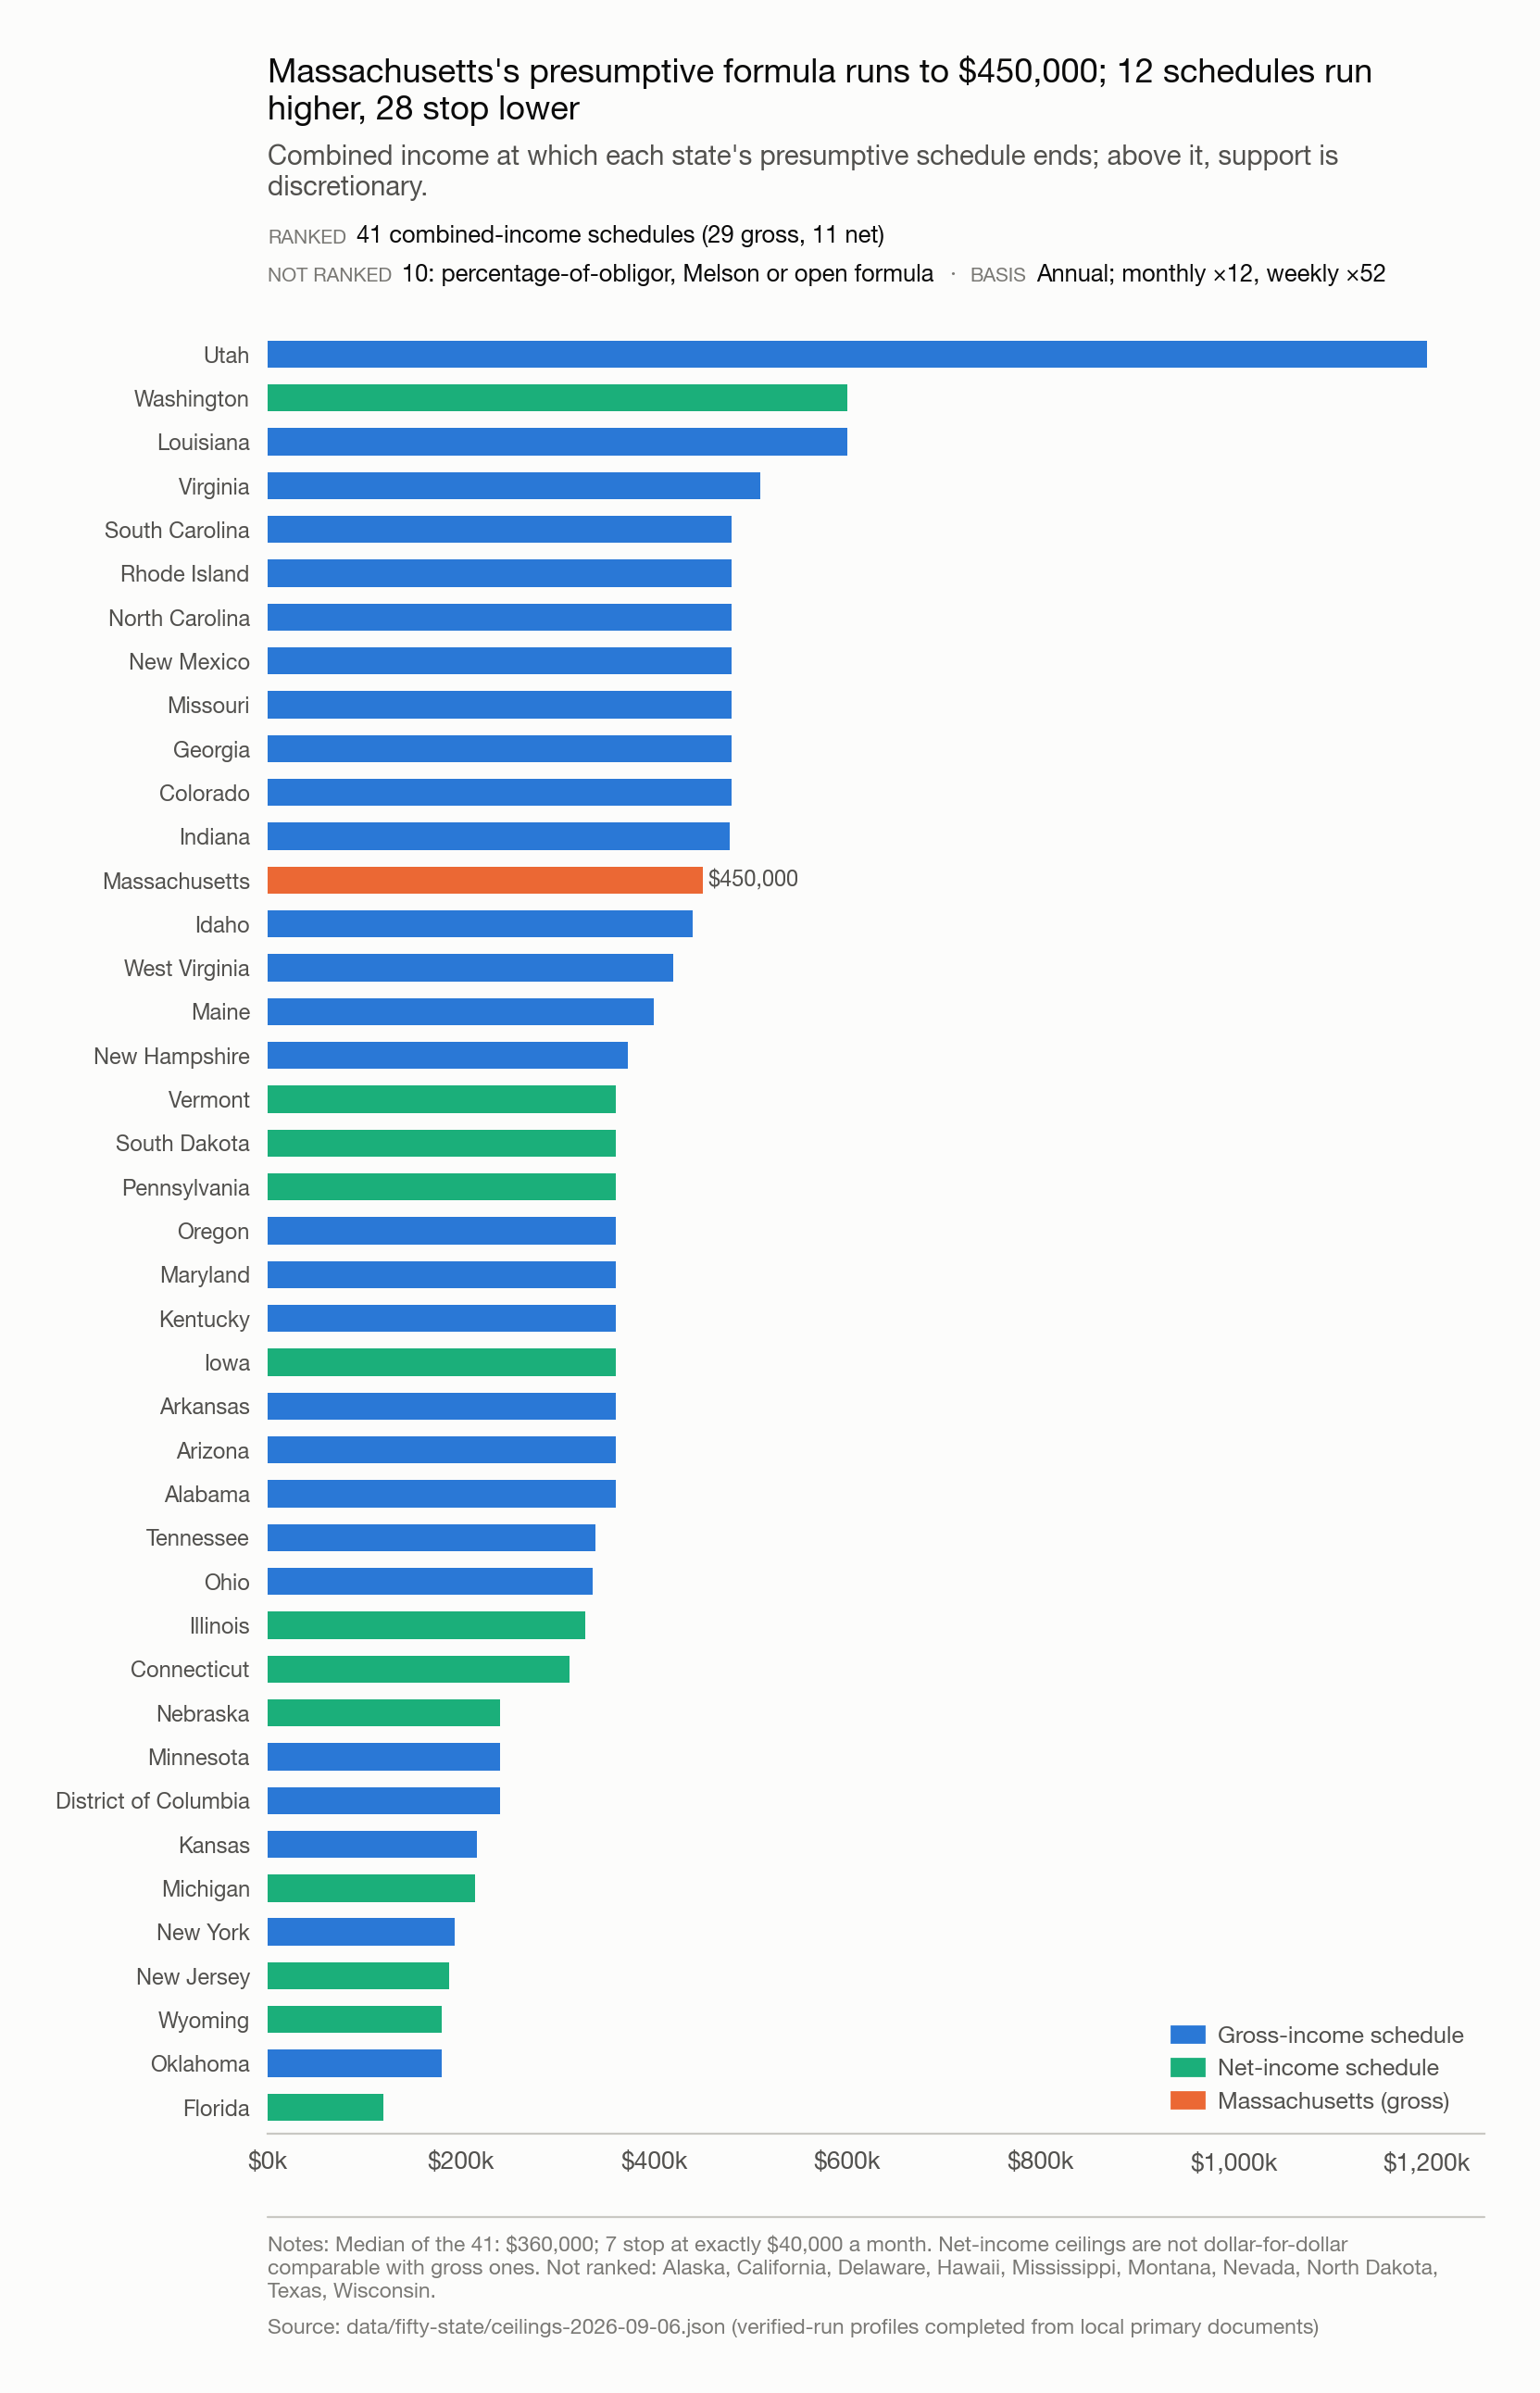
Massachusetts's presumptive formula runs to $450,000; 12 schedules run higher, 28 stop lower.
Forty-one jurisdictions have a combined-income schedule that stops at a stated figure; the median is $360,000, seven stop at exactly $40,000 a month, and Utah's runs to $1.2 million.
Ten jurisdictions use a percentage-of-obligor, Melson, or open formula with no combined ceiling. Net-income ceilings are not dollar-for-dollar comparable with gross ones.
Source: model/charts/fig9_ceilings.py ·
data (JSON) ·
data (CSV)
Method: every jurisdiction's stated ceiling, and the ten with none
| Rank | Jurisdiction | Ceiling (annual) | Basis |
|---|---|---|---|
| 1 | Utah | $1,200,000 | gross |
| 2 | Louisiana | $600,000 | gross |
| 3 | Washington | $600,000 | net |
| 4 | Virginia | $510,000 | gross |
| 5 | Colorado | $480,000 | gross |
| 6 | Georgia | $480,000 | gross |
| 7 | Missouri | $480,000 | gross |
| 8 | New Mexico | $480,000 | gross |
| 9 | North Carolina | $480,000 | gross |
| 10 | Rhode Island | $480,000 | gross |
| 11 | South Carolina | $480,000 | gross |
| 12 | Indiana | $478,400 | gross |
| 13 | Massachusetts, this page’s worked example | $450,000 | gross |
| 14 | Idaho | $440,000 | gross |
| 15 | West Virginia | $420,000 | gross |
| 16 | Maine | $400,000 | gross |
| 17 | New Hampshire | $373,068 | gross |
| 18 | Vermont | $360,300 | other |
| 19 | Alabama | $360,000 | gross |
| 20 | Arizona | $360,000 | gross |
| 21 | Arkansas | $360,000 | gross |
| 22 | Iowa | $360,000 | net |
| 23 | Kentucky | $360,000 | gross |
| 24 | Maryland | $360,000 | gross |
| 25 | Oregon | $360,000 | gross |
| 26 | Pennsylvania | $360,000 | net |
| 27 | South Dakota | $360,000 | net |
| 28 | Tennessee | $339,000 | gross |
| 29 | Ohio | $336,000 | gross |
| 30 | Illinois | $328,500 | net |
| 31 | Connecticut | $312,000 | net |
| 32 | District of Columbia | $240,000 | gross |
| 33 | Minnesota | $240,000 | gross |
| 34 | Nebraska | $240,000 | net |
| 35 | Kansas | $216,000 | gross |
| 36 | Michigan | $214,459 | net |
| 37 | New York | $193,000 | gross |
| 38 | New Jersey | $187,200 | net |
| 39 | Oklahoma | $180,000 | gross |
| 40 | Wyoming | $180,000 | net |
| 41 | Florida | $120,000 | net |
Ten further jurisdictions state no combined-income ceiling for their presumptive schedule:
| Jurisdiction | Formula type |
|---|---|
| Alaska | obligor cap, not combined income |
| California | no stated ceiling |
| Delaware | no stated ceiling |
| Hawaii | no stated ceiling |
| Mississippi | obligor cap, not combined income |
| Montana | no stated ceiling |
| Nevada | obligor cap, not combined income |
| North Dakota | obligor cap, not combined income |
| Texas | obligor cap, not combined income |
| Wisconsin | no stated ceiling |
Massachusetts charges more for joint custody than 47 states charge when the recipient has primary custody
Here and throughout the site, "47 states" counts the District of Columbia, which sets its own guidelines, as one of the 47.
The same worked example, recombined: Massachusetts under Box 1 (children half the time with each parent) is placed on the same scale as every other jurisdiction computed with the children primarily with the lower earner. Only Hawaii and Wisconsin order more at primary custody than Massachusetts does at equal time; Massachusetts’s own primary-custody order, $4,714.22, is included for scale. Both jurisdictions are checked against a primary document: Hawaii’s own 2024 Guidelines compute the order on net income, converting each parent’s gross pay through a published table before the worksheet runs; Wisconsin’s own court-form worksheets set the percentage-of-income schedule on gross income, the same basis Massachusetts uses.
The Commonwealth’s own consultant attributes Massachusetts’s higher amounts to cost of living, not formula design (see Attachment D). Cost of living may explain the level of Massachusetts’s orders generally, but it doesn’t explain why an arrangement giving each parent half the time is priced here where sole primary custody is priced almost everywhere else.
The federal government’s own cost-of-living measure does not back the explanation either. The Bureau of Economic Analysis’s Regional Price Parities, all items, score Massachusetts 105.8 for 2024, lower than six other places: California scores 110.7, Hawaii scores 110.0, the District of Columbia scores 109.9, New Jersey scores 108.8, New York scores 107.9, and Washington scores 107.0. Every one of those six orders less than Massachusetts at equal parenting time. If cost of living set the ranking, the six most expensive places in the country would sit above Massachusetts, not below it. (Source: Bureau of Economic Analysis, Regional Price Parities by State, 2024, released February 19, 2026.) The cost-of-living page sets the six side by side, at equal time and at primary custody.
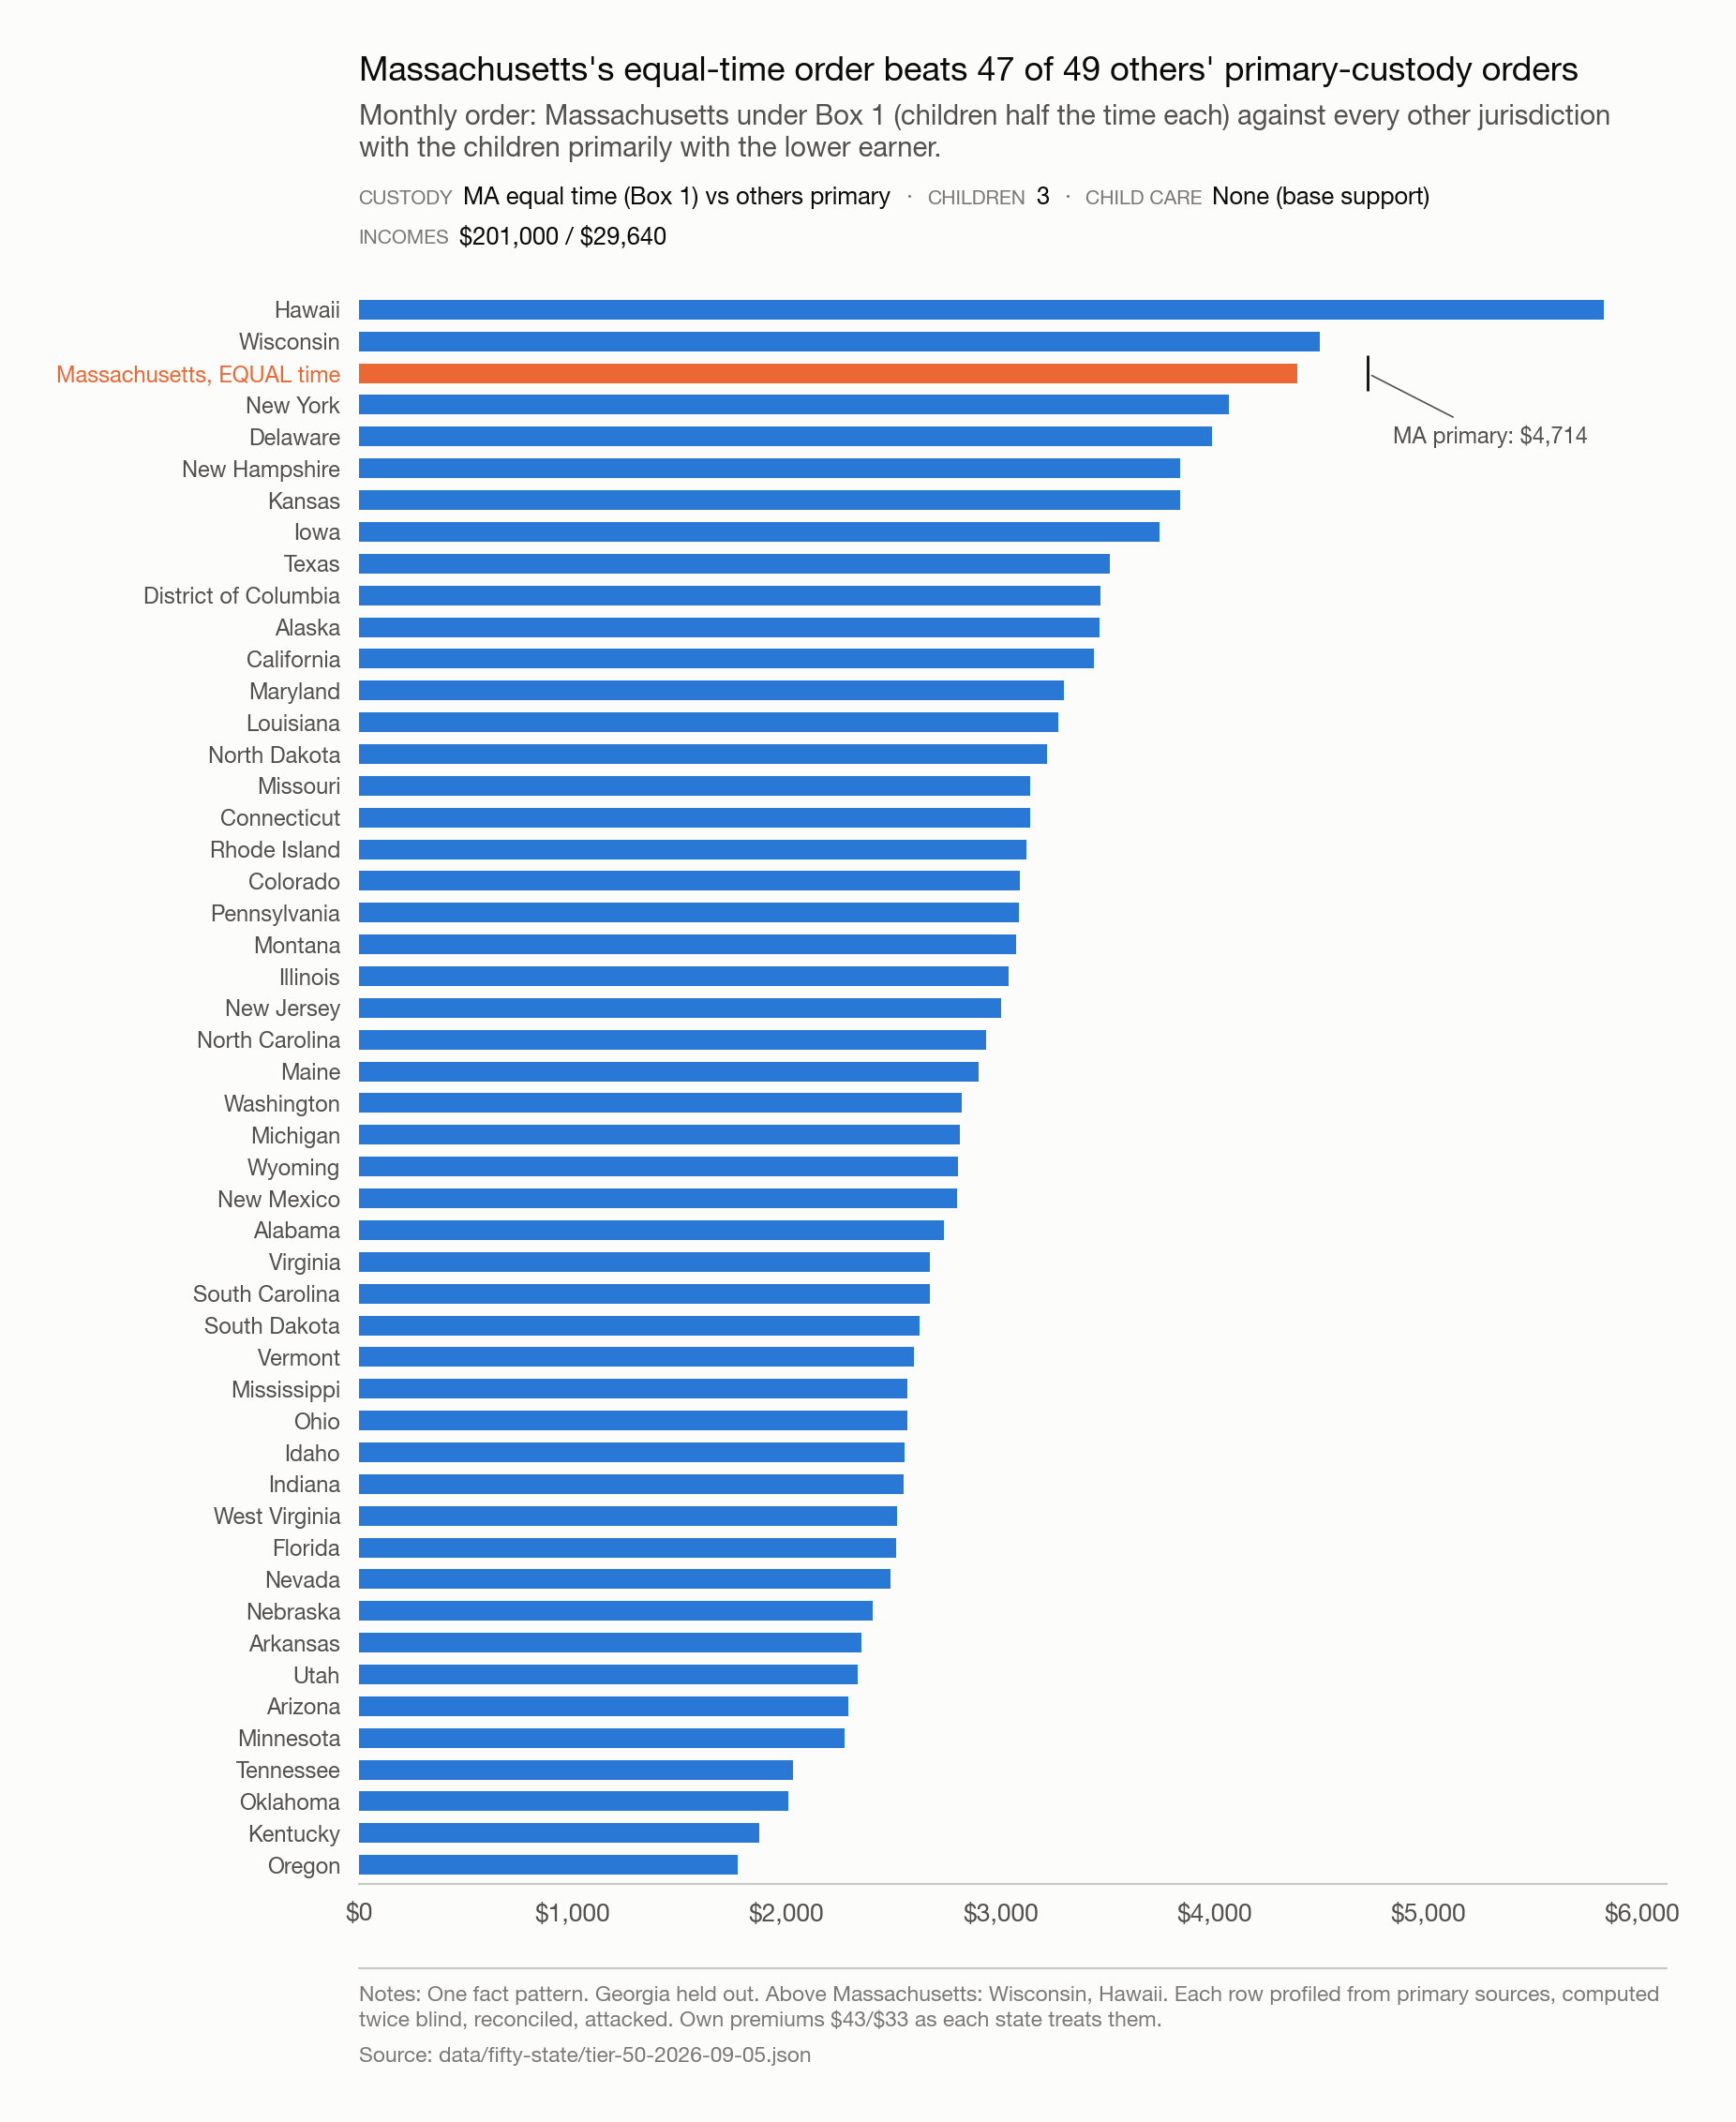
At primary custody, only Wisconsin and Hawaii order more than Massachusetts does at equal time.
The same worked example as the two rankings above, with Massachusetts computed under Box 1 and every other jurisdiction computed with the children primarily with the lower earner.
Massachusetts's own primary-custody order, $4,714, is marked for scale and isn't part of the ranked comparison.
Source: model/charts/fig10_ma_shared_vs_primary.py ·
data (CSV)
Method: the full combined table, Massachusetts equal-time vs. every jurisdiction's primary-custody order
| Rank | Jurisdiction | Custody basis | Monthly order |
|---|---|---|---|
| 1 | Hawaii | primary | $5,821.00 |
| — | Massachusetts, this page’s worked example | primary (for scale, not ranked) | $4,714.22 |
| 2 | Wisconsin | primary | $4,491.71 |
| 3 | Massachusetts, this page’s worked example | equal | $4,388.48 |
| 4 | New York | primary | $4,067.61 |
| 5 | Delaware | primary | $3,990.73 |
| 6 | New Hampshire | primary | $3,838.66 |
| 7 | Kansas | primary | $3,838.03 |
| 8 | Iowa | primary | $3,744.73 |
| 9 | Texas | primary | $3,510.00 |
| 10 | District of Columbia | primary | $3,467.96 |
| 11 | Alaska | primary | $3,462.96 |
| 12 | California | primary | $3,436.04 |
| 13 | Maryland | primary | $3,295.11 |
| 14 | Louisiana | primary | $3,269.06 |
| 15 | North Dakota | primary | $3,219.00 |
| 16 | Missouri | primary | $3,139.00 |
| 17 | Connecticut | primary | $3,138.20 |
| 18 | Rhode Island | primary | $3,123.22 |
| 19 | Colorado | primary | $3,090.30 |
| 20 | Pennsylvania | primary | $3,086.76 |
| 21 | Montana | primary | $3,073.50 |
| 22 | Illinois | primary | $3,037.90 |
| 23 | New Jersey | primary | $3,002.31 |
| 24 | North Carolina | primary | $2,934.30 |
| 25 | Maine | primary | $2,899.02 |
| 26 | Washington | primary | $2,819.56 |
| 27 | Michigan | primary | $2,808.44 |
| 28 | Wyoming | primary | $2,801.97 |
| 29 | New Mexico | primary | $2,795.32 |
| 30 | Alabama | primary | $2,736.00 |
| 31 | Virginia | primary | $2,672.09 |
| 32 | South Carolina | primary | $2,669.21 |
| 33 | South Dakota | primary | $2,623.12 |
| 34 | Vermont | primary | $2,594.42 |
| 35 | Mississippi | primary | $2,564.76 |
| 36 | Ohio | primary | $2,564.15 |
| 37 | Idaho | primary | $2,549.85 |
| 38 | Indiana | primary | $2,548.03 |
| 39 | West Virginia | primary | $2,518.77 |
| 40 | Florida | primary | $2,512.99 |
| 41 | Nevada | primary | $2,485.00 |
| 42 | Nebraska | primary | $2,402.03 |
| 43 | Arkansas | primary | $2,349.64 |
| 44 | Utah | primary | $2,332.66 |
| 45 | Arizona | primary | $2,290.06 |
| 46 | Minnesota | primary | $2,271.30 |
| 47 | Tennessee | primary | $2,031.00 |
| 48 | Oklahoma | primary | $2,008.78 |
| 49 | Kentucky | primary | $1,871.67 |
| 50 | Oregon | primary | $1,772.00 |
While two task forces declined to move to net income, three economic reviews since have reported the amounts running above the benchmarks
Every ranking above uses each jurisdiction’s own income basis, gross or net as its guidelines define it, because that’s how each state actually calculates its order. The ceiling table above states the basis for jurisdictions with a stated combined-income cap; the two jurisdictions that outrank Massachusetts in the comparison above are noted where that claim is made. Massachusetts uses gross throughout, and whether gross is the right basis is a live, unresolved question inside its own review process.
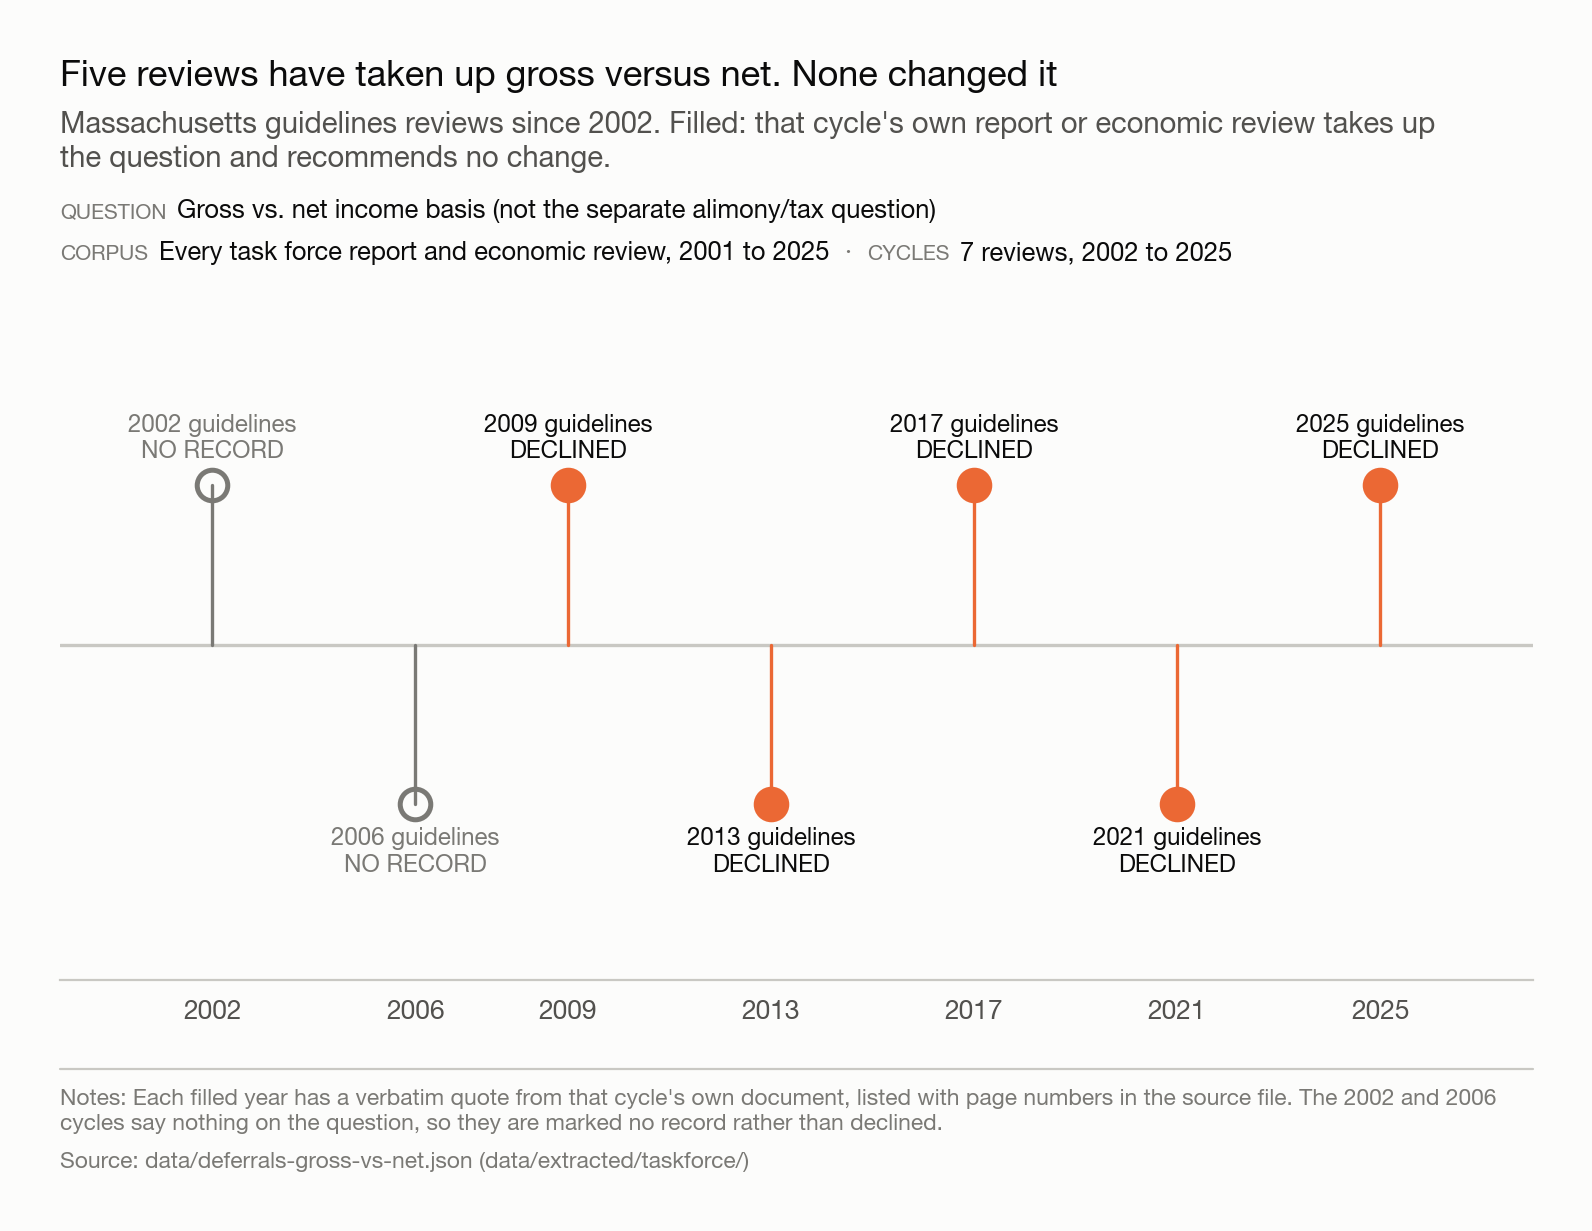
Five reviews have taken up gross versus net. None changed it.
Massachusetts guidelines reviews since 2002. Filled: the cycle's own report or economic review declines the change.
Each filled year carries a verbatim quote from that cycle's own document, with page numbers in the source file. The 2002 and 2006 reviews say nothing on the question.
Source: model/charts/fig11_deferral_timeline.py ·
data (CSV)
The 2008 Report of the Child Support Guidelines Task Force records that there was little support on the Task Force for basing orders on net income, although this was suggested and discussed.
The 2012 Report goes further and names the source of the request: a recurrent comment from noncustodial parents was the suggestion to base the Guidelines on net income instead of gross. The Task Force declines to recommend this change. The Task Force reasons that the current practice of utilizing the combined gross income of the parties remains the simplest option.
Simplicity is the reason given. Neither report states a finding that a gross basis measures the burden correctly.
The three economic reviews since then were commissioned by the Commonwealth and reported something else again. The 2017 review found the Massachusetts amounts for one child have been higher than all of the benchmarks in at least the last two quadrennial reviews in 2008-2009 and 2012-2013
, and running 37 and 63 percent above the USDA national estimates at middle and high incomes. The 2021 review found the same pattern at 34 and 58 percent. The 2025 review records that gross versus net was discussed again in this review, as prior task forces have done
, with no change recommended at this time
. The analysis was done. The amounts stayed.
Every figure here is one family at one set of incomes, and the ranking holds for that family only
One worked example is not a distribution. Nothing here says what a lower-income family, a two-child family, or a family with claimed child care would see in any of these fifty jurisdictions; those are different points that have not been computed.
Nothing here says Massachusetts's amounts are wrong. The Commonwealth's own consultant's stated reason for them is cost of living; this page does not test or dispute it. What this page does show, at the one worked example tested: an arrangement giving each parent equal time is priced by Massachusetts's Worksheet at a level most other jurisdictions reserve for one parent having the children the great majority of the time.
Check it yourself
The rankings come from these files, each state worked out twice and checked for errors.
- The data
tier-50-2026-09-05.jsoncredit-at-122-2026-09-05.jsonceilings-2026-09-06.jsondeferrals-gross-vs-net.jsonThe gross-vs-net deferral timeline's own source, grepped fromdata/extracted/*.flow.txt.