
Federal law should cap what any state can order, and the Worksheet needs twelve changes inside it
While federal law requires every order to rest on the parent’s ability to pay, it sets no cap on the order and does not require a worksheet to test it against what a parent keeps. The first section below asks the federal government to close that gap for every state. The five sections after it are specific to the Massachusetts Worksheet: each names the line it would change and what that change does to the order at the worked example throughout this site, a payor at $201,000 a year, the other parent at $29,640, three children. Each row’s summary names its own case: equal time with no child care, equal time with $300 a week of child care, or primary custody. Open a row to read the case for it.
Each proposal below carries one of three labels. A correction means the Worksheet applies two different measures inside one calculation, or tests a quantity against a threshold in different units. It is wrong on its own terms, whichever way you think support should go, and three of the five Worksheet corrections change a dollar figure. A judgement picks a number, a rate or a cap, or installs a rule where the form has none: someone who accepts every figure on this page can still disagree with it. A disclosure changes no dollar figure and records or surfaces something the form currently leaves unrecorded, in either direction. Six, seven and six of the nineteen proposals below.
Every proposal here that changes a dollar figure lowers what the payor owes, with one exception, which is marked as such where it appears. That is the direction the findings run, and it is worth saying before the first one rather than after the last. The same model and the same worked example produced every figure on this page. Where the arithmetic runs the other way, the page says so. Massachusetts sets high orders. A page that reports what its Worksheet does will read accordingly.
Federal law should cap what any state can order, and require it to show its work
Federal law sets no cap on a presumptive order and does not require a worksheet to test it against what a parent keeps. A petition to the U.S. Department of Health and Human Services asks the federal government to fix that for every state, not just Massachusetts: a ceiling on the order itself, and disclosure that makes a worksheet show its work. The federal law finding on this site has the Massachusetts figures the petition is built on.
Define ability to pay federally, and cap every state's order at 40 percent of itNo dollar change by itself. The recommendations below apply the number to Massachusetts.JudgementIn the petition to HHS
Federal law sets no cap on a presumptive order. It requires the order to rest on ability to pay and never defines the term. The petition asks the U.S. Department of Health and Human Services to define it as the payor’s net pay less the child care he pays himself, and to cap every order at 40 percent of it, with 30 percent in joint custody as an interim limit while the Department reviews the cross-credit method below. Both numbers already exist in Massachusetts’s own rules. Section IV.C calls 40 percent of income a hardship, and the hardship and joint custody recommendations below ask Massachusetts to apply those same two numbers to net pay rather than gross.
Federal law already requires a protection like this at the bottom of the income range: every state’s guidelines must protect a low earner “by incorporating a low-income adjustment, such as a self-support reserve or some other method determined by the State,” with the method left to the state, 45 C.F.R. § 302.56(c)(1)(ii). This ask writes the same kind of federal floor at the top of the range instead of the bottom.
Make every state's worksheet compute net pay, and test the order against the federal ceilingNo dollar change. It requires the worksheet to check its own arithmetic against the same measure Massachusetts already uses to collect the order.CorrectionIn the petition to HHS
Massachusetts already measures this obligation in net pay once, when it collects: the withholding statute, G.L. c. 119A § 12, cites the federal ceiling three times. It never measures net pay when it sets the amount. The petition asks federal law to close that gap for every state: compute net pay on the worksheet or form that produces the order, run every hardship test and deviation trigger on that net figure, and compare the order to the federal limit on wage withholding, 60 percent of take-home pay, less for a parent who supports a second household.
Massachusetts’s Worksheet can already set child support higher than federal law lets the state collect from wages. With $100 a week of child care claimed for each child, 40% of three-child, primary-custody income pairs on a model grid have an order that takes more than half of take-home pay, and 10.6% cross the 60 percent limit itself. All of those also trip Massachusetts’s own 40 percent hardship presumption, which a parent must raise and a judge must grant. It corrects nothing automatically. The federal law finding has the grid in full; the hardship test below shows the same gap inside Massachusetts’s own rule.
Define joint custody federally as at least a third of the time, and cap it at what the cross-credit formula producesAt the worked example the equal-time order falls from $1,012.73 to $701.30 a week.JudgementIn the petition to HHS
Massachusetts’s own Guidelines already mark a third of the time as the point where parenting time starts to matter: Section II.D.4 lets a judge consider a deviation once a parent has well over a third of the time but less than half. The Commonwealth tried pricing every day in that range once before and took it back out. Its 2017 Task Force found that letting the order move by the day “increased litigation and acrimony between parents, shifted the focus from a parenting plan that is in the best interests of the children to a contest about a parenting plan that attempts to reduce a child support order, and failed to create the consistency in child support orders that it sought to create,” and removed it. The 2025 Guidelines brought the same pricing back as a deviation. A rule a state has removed once and restored once cannot be relied on to hold the line on its own.
The petition asks federal law to set the definition instead, and to require the method 19 jurisdictions already use, the cross-credit formula at the standard 1.5 multiplier. Once a parent has the child at least a third of the time, the formula would weight each parent’s amount by the time the child spends with the other, so no single night is worth much. How the cross-credit works, and which states use it → The Parenting time recommendations below apply the same formula to Massachusetts.
Say plainly whether a schedule runs on gross or net income, and show the conversionNo dollar change. It is a disclosure the Worksheet already knows how to produce.DisclosureIn the petition to HHS
Most state schedules, Massachusetts’s included, are built from research measured in net income and then applied to gross pay. Someone converts one to the other. Massachusetts’s own consultant already performs that conversion every review cycle, using “standard withholding for Social Security and Medicare,” an assumption never published alongside the guidelines. The petition asks federal law to require every state to say which income basis its schedule uses, identify the basis of the research behind it, and publish the conversion where the two differ. A state that has already done the conversion loses nothing by writing down what it already computed.
Publish the date of the next guidelines review where the guidelines themselves are publishedNo dollar change.DisclosureIn the petition to HHS
Federal law already requires a state to publish four things about its review process: the reports, who sits on the reviewing body, the effective date, and the date of the next review, 45 C.F.R. § 302.56(e). Massachusetts publishes the first three. The fourth appears exactly once in the whole published record, inside a cost forecast: “between now and the next guidelines review in 2029.” The petition asks that this date be written where a parent would actually look, on the same page as the guidelines themselves. The ask requires no new review, no new report and no new analysis. The date already exists. The ask is where it is written down.
Let a parent paying under the current Guidelines ask for immediate reliefAn order could ask to be capped now, at 40 percent of ability to pay under primary custody or 30 percent in joint custody, without showing any other change in circumstances.JudgementIn the petition to HHS
Today an order can be reviewed only back to whatever the guidelines currently allow, 42 U.S.C. § 666(a)(10). If Massachusetts’s guidelines do not rest on ability to pay the way federal law requires, that review checks the order against the same rule that produced it, which is no review at all. The petition asks the Department to let any parent whose order was set under guidelines it finds do not comply ask for an immediate reduction, without showing any other change in circumstances, to what the corrected rule allows: no more than 40 percent of ability to pay, and no more than 30 percent in joint custody. The 40 percent is the cap above, applied now. The 30 percent is an interim limit for joint custody until the cross-credit method is in place.
The Worksheet splits child care before the order moves money, and should split it after
The Worksheet splits child care on each parent’s share of income before the order moves any money. These would split it on what each parent holds after.
Split child care after the base order, on each parent's income before taxThe higher earner's child care share falls from 87.7 to 64.5 percent; the order with $300 a week of child care falls from $1,275.77 to $1,206.08 a week.CorrectionIn the comments to the Trial Court
Line 6b charges each parent a share of the child care bill, and it uses the income split from before any support is paid. At the worked example that makes the higher earner responsible for 87.7 percent of it, even though the base order has already moved money to the other household.
This change uses the same income the Worksheet already computes, Line 3a available income, but reads it after the base order rather than before. The higher earner’s share becomes 64.5 percent, and the order with $300 a week of child care falls from $1,275.77 to $1,206.08 a week. In the comments this is the fallback, renumbered Line 6b-2.
It is the fallback rather than the ask for one reason: available income is measured before tax, and the household that receives the order pays tax at a very different rate from the one that sends it. Measuring after tax is the next row, and it is what the comments lead with. This version exists because it needs no tax computation at all, and no field the Worksheet does not already have. Measured after tax instead, the same rule takes the order to $1,171.64 a week.
Split child care after the base order, on each parent's income after tax (recommended)The higher earner's child care share falls from 87.7 to 53.0 percent; the order with $300 a week of child care falls from $1,275.77 to $1,171.64 a week, a $5,415-a-year change.CorrectionIn the comments to the Trial Court
Child care should be allocated on each parent’s share of after-tax resources following the order, instead of the 87.7 percent pre-order split the Worksheet uses today.
At the worked example, three children, $300 a week in child care paid by the recipient: the payor’s Line 3c income share before the order is 87.7 percent, and Line 6b charges the payor that share of the $15,600 a year. But the order has already moved money between the households: after the transfer, the payor’s raw share of combined gross is 64.3 percent (a different quantity from the 64.5 percent Line 6b-2 fallback figure below, which measures Line 3a available income, not gross), and on a withholding basis, income tax and FICA for a single filer claiming no exemptions, the payor’s share of combined net is 53.0 percent.
The recommended fix, and now the comments’ own lead redline, allocates child care on that post-transfer net split, using new Worksheet Lines 6b-1a and 6b-1. It changes the order itself, from $1,275.77 to $1,171.64 a week, because those lines sit inside the chain that produces Line 7d. The Worksheet holds no net-income figure today, so the comments also offer a fallback confined to lines it already computes, renumbered Line 6b-2, which reaches 64.5 percent with no tax computation at all.
Two other options the author raised are shown in the table below for comparison: removing child care from the Worksheet entirely, so each parent bears 0 percent of the other’s cost, and splitting it 50-50 after base support is computed, regardless of income.
| Rule | Weekly order | Payor’s child care share | Payor’s yearly child care |
|---|---|---|---|
| Current worksheet (pre-transfer Line 3c shares) | $1,275.77 | 87.7% | $13,678 |
| Post-transfer shares of available income, Line 3a (Line 6b-2, fallback without a net computation) | $1,206.08 | 64.5% | $10,054 |
| Removed from the worksheet entirely | $1,012.73 | 0.0% | $0 |
| Split 50-50 after base support | $1,012.73 | 50.0% | $7,800 |
| Post-transfer net shares, withholding basis (recommended; the comments’ lead redline, Line 6b-1) | $1,171.64 | 53.0% | $8,263 |
The recommended row changes the order itself, because the line it adds sits inside the chain that produces the order. The two rows above it, which move the payment outside the worksheet, leave the order at the no-child-care figure.
Counting the refundable credits as well, under the alternating-year Child Tax Credit convention this model now uses (head-of-household status and the Earned Income Tax Credits stay with whoever has the children more), the higher earner’s share would instead be 49.7 percent. The comments ask for the narrower figure, because the worksheet has no field for which parent claims which child and that claim is often alternated year to year.
The equal-time credit shrinks as the income gap widens, because no line of the form prices parenting time
Splitting the week equally cuts the order 6.9 percent, and that credit shrinks as the income gap widens, because no line in the form contains a parenting-time term.
Set the equal-time discount with the cross-credit formula 18 states and DC use (recommended)Equal-time order falls from $1,012.73 to $701.30 a week, a 30.8 percent cut.JudgementIn the comments to the Trial Court
At equal parenting time, Massachusetts’s order should fall to what a standard cross-credit formula produces, using the 1.5 multiplier most cross-credit states use. How it works →
Oldham and Venohr counted 23 states doing this in 2020: “The cross-credit formula is used by 23 states,” which “increase the basic obligation owed by both parents by 50% to account for some child-rearing expenses being duplicated when both parents have substantial access” (The Relationship Between Child Support and Parenting Time, 54 Fam. L.Q. 141, 152-53 (2020)). This project’s own state-by-state check finds 18 of those states and DC still using the standard 1.5 multiplier today. A few states use no multiplier, or one other than 1.5.
A cross-credit at a 1.5 duplication factor is already what the comments ask the Trial Court to adopt as Variant B: it’s what most states with a cross-credit use, and it’s the one candidate that keeps working as the income gap widens instead of collapsing the way today’s credit does. It cuts the order 30.8 percent, to a monthly figure 7.8 percent above Washington and 25.4 percent above California, and 39.9 percent above the fifty-jurisdiction median.
A simpler alternative is a straight linear discount on the time split: no discount at one night in three, a 50 percent discount at half the time, pricing Massachusetts 16.4 percent below Washington and 2.8 percent below California. The cross-credit stays the recommendation, because the linear version prices Massachusetts below both comparison states instead of in line with them.
| Rule | Weekly order | Monthly | Against the median | Against WA | Against CA |
|---|---|---|---|---|---|
| Today’s Box 1 (equal parenting time) order (no credit redesign) | $1,012.73 | $4,388.48 | +102.0% | — | — |
| Variant A: 6e limitation moved to the transfer | $935.06 | $4,051.93 | +86.5% | +43.7% | +67.1% |
| Cross-credit at duplication 1.5 (recommended) | $701.30 | $3,038.95 | +39.9% | +7.8% | +25.4% |
| Linear discount at 50% of overnights | $543.95 | $2,357.11 | +8.5% | -16.4% | -2.8% |
“Against the median / WA / CA” states how far the candidate’s monthly figure sits above or below the fifty-jurisdiction median ($2,172.95), Washington’s equal-time order ($2,819.56), and California’s equal-time order ($2,424.32). Today’s Box 1 order’s own distance from Washington and California isn’t printed by the model; its distance from the median (102.0 percent) is. Reaching the median exactly would take $511.27 a week off today’s order, a 50.5 percent cut.
Research on custody decided mainly by a financial incentive finds children can fare worse under it (Fernández-Kranz, Roff and Sun, Journal of Economic Behavior & Organization 189 (2021)), an argument against pricing parenting time by formula in either direction, whether a credit shrinks or grows. The cross-credit recommended here and the linear alternative both still price it by formula, so that caution applies to this proposal the same way it applies to today’s line. What it argues for is fixing the line the Worksheet already runs, not enlarging a credit for its own sake.
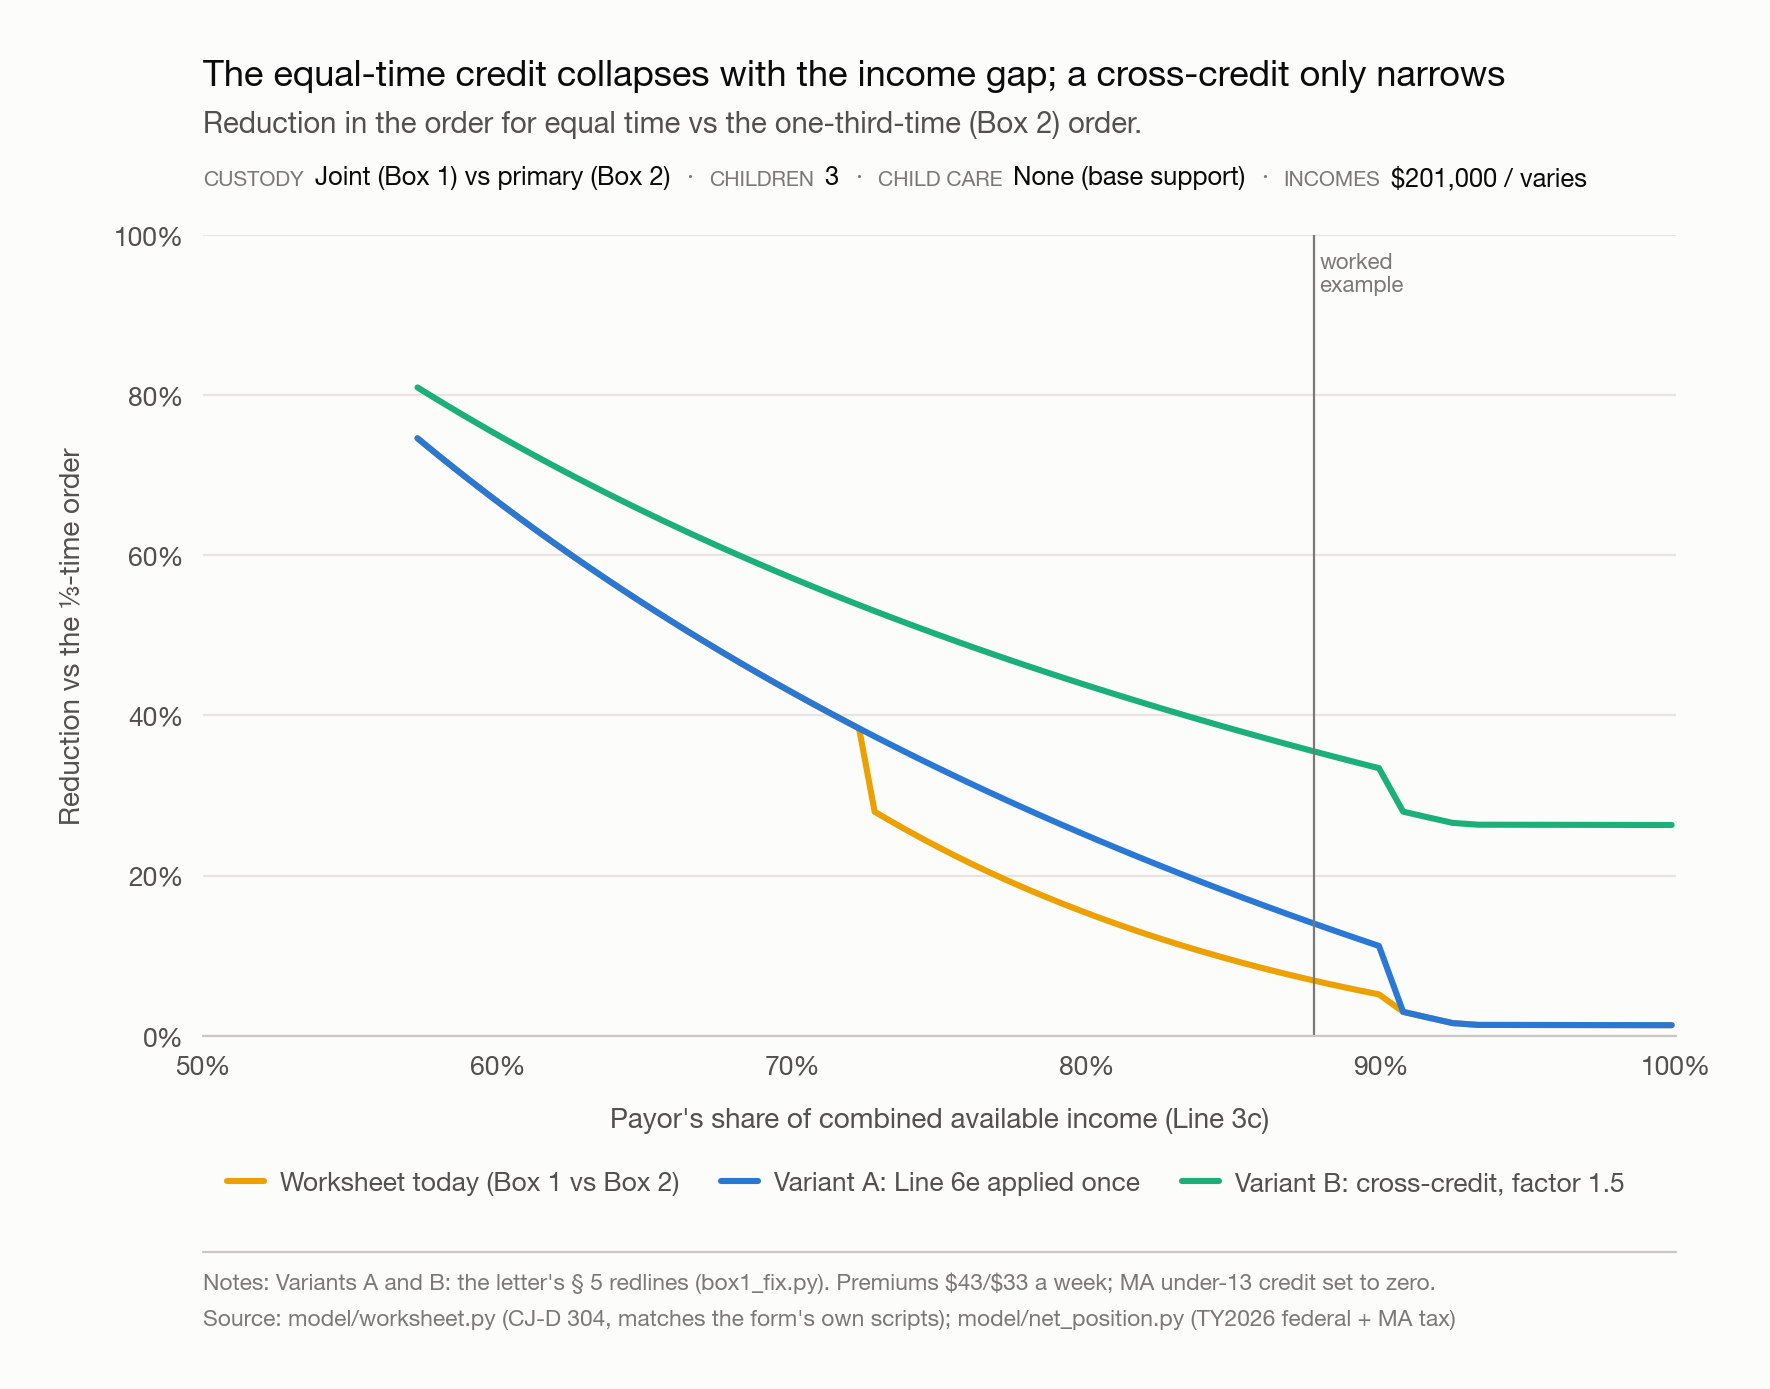
The Worksheet's equal-time credit collapses as the income gap widens.
Reduction in the order for equal time, against the Box 2 order (the paying parent has the children about a third of the time).
The reduction falls from about 75 percent at a 57 percent payor income share to 7 percent at 88 percent and 1 percent at 96 percent: no parenting-time quantity enters any line. Variant A, applying Line 6e once, lifts the curve. Variant B, the standard cross-credit at a 1.5 duplication factor used by 18 states and DC, stops it collapsing. Both are the letter's § 5 redlines.
Source: model/box1_fix.py ·
data (CSV)
Today’s uncredited equal-time order already sits above almost every state’s primary-custody order, which is the scale this recommendation is measured against.
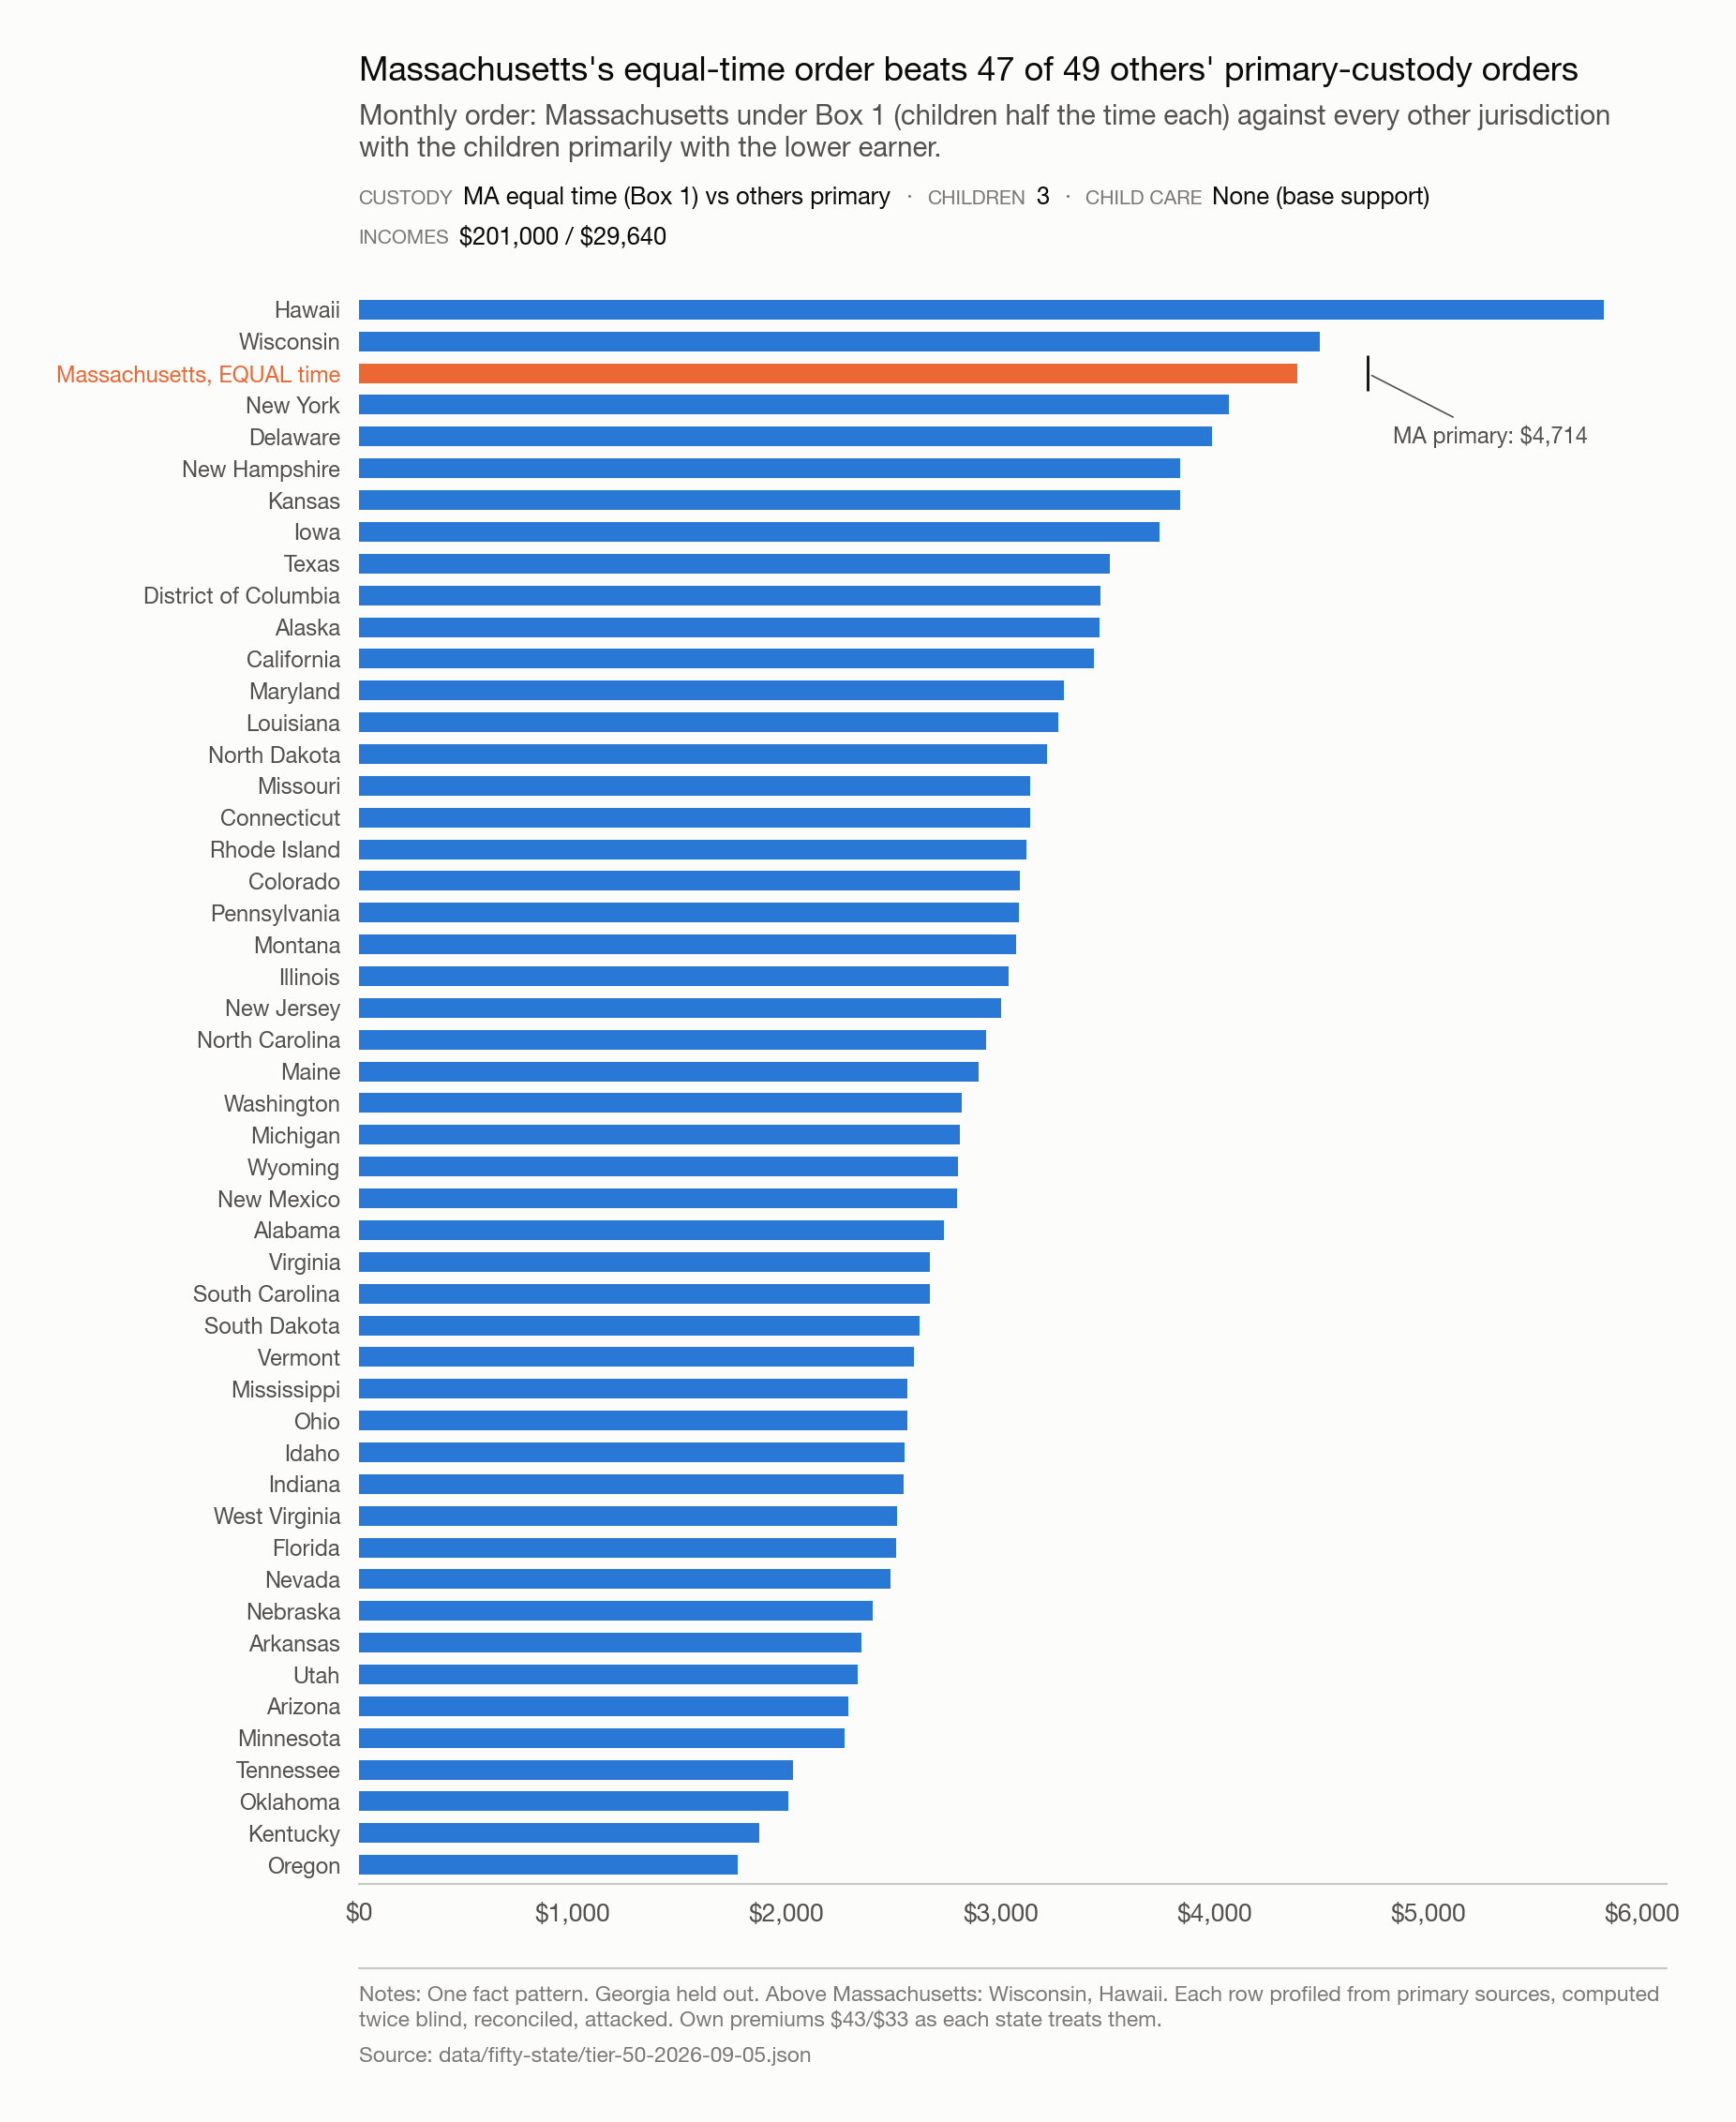
At primary custody, only Wisconsin and Hawaii order more than Massachusetts does at equal time.
Monthly order: Massachusetts under Box 1 (children half the time each) against every other jurisdiction with the children primarily with the lower earner.
Only Hawaii and Wisconsin order more at primary custody than Massachusetts does at equal time. Massachusetts's own primary-custody order, $4,714, is marked for scale and isn't part of the ranked comparison. One worked example; Georgia held out.
Source: model/charts/fig10_ma_shared_vs_primary.py ·
data (CSV)
Cap the order at 30 percent of net pay when the parents split time equallyOrder falls from $1,012.73 to $806.73 a week.JudgementIn the comments to the Trial Court
Where the children are with each parent about half the time, both households carry the fixed cost of housing them, a bedroom in each home kept year round. Every income-shares state that credits shared parenting through a cross-credit recognises this: most apply a 1.5 duplication factor (a few use no multiplier, or one other than 1.5), and Indiana’s Guideline 6 Commentary puts the duplicated share of the basic obligation at 50 percent. The Massachusetts Worksheet contains no parenting-time quantity in any line, so its credit for equal time is only the difference in income shares, and it collapses as the income gap widens.
The position: at equal time the order should not exceed 30 percent of the payor’s net pay, against 40 percent at primary custody, until the Worksheet prices shared parenting with the cross-credit.
Two jurisdictions cap the order, and neither sets a lower cap for joint custody. Washington caps any order at 45 percent of net income except for good cause, RCW 26.19.065(1), and the District of Columbia at 35 percent of adjusted gross income, child care included, D.C. Code § 16-916.01(n). The support for a ceiling in principle, the federal garnishment cap and the Center for Policy Research statement noted earlier, under the heading about capping what any state can order, is support for the idea of a net ceiling, not for this number.
What it would cost. A 30 percent ceiling reaches no one-child equal-time order on the published grid, 29.1 percent (334 of 1,147) of two-child orders, and 48.8 percent (560 of 1,147) of three-child orders. At the worked example it would take the order from $1,012.73 a week down to $806.73. For families with two or three children that is a different schedule for shared custody, and it should be argued as one.
Where it bites is the argument for it. The share of net an order takes is driven by the gap between the two incomes, not by either income alone. Holding the higher earner at $201,000 with three children at equal time, the ceiling binds while the other parent earns under about $85,000 and stops binding above it. That is the same region where the equal-time credit collapses from 75 percent of the primary-custody order to under 7 percent. The ceiling reaches the cases the Worksheet already handles worst.
Stop a rule written for low earners from shrinking the equal-time discountEqual-time order falls from $1,012.73 to $935.06 a week, a 7.7 percent cut.CorrectionIn the comments to the Trial Court
Apply the Worksheet’s low-income limit at the transfer, where a primary-custody case already applies it, instead of applying it to the equal-parenting credit.
The Guidelines cap a parent’s support figure when it would come to less than 10 percent of that parent’s available income. It is a protection for a low earner. With the children primarily with one parent, the Worksheet applies that cap at Line 7b, to what the payor owes.
With the parents splitting time equally it applies the cap earlier, at Line 6e. At equal time Line 6e is not what the payor owes: it is the credit the payor receives for having the children half the week. So a rule written to protect a low earner reduces the higher earner’s credit instead. At the worked example it takes that credit from $152.84 to $75.17 a week. Slightly more than half of it is gone.
Applying the cap at Line 7b, the way a primary-custody case already does, takes the equal-time order from $1,012.73 to $935.06 a week, a 7.7 percent cut.
The hardship test reads income measured before tax, while the order is paid from take-home pay
Section IV.C calls 40 percent of income a hardship, then measures it on gross while the order is paid from net.
Measure the 40 percent hardship test on net income, not on grossNo dollar change. The 40 percent presumption doesn't apply until the payor reaches 57 percent of net income.CorrectionIn the comments to the Trial Court
- Measure the hardship test on the same income basis the order is paid from. At $300 a week of claimed child care, Line 7e reads 33.4 percent of gross-derived income while the same order is 47.4 percent of the payor’s net; the presumption itself does not kick in until 56.9 percent of net. The fix changes what the form reports. It leaves every dollar amount untouched.
Cap the order at 40 percent of net pay, the hardship level the Worksheet already namesOrder falls from $1,087.90 to $1,075.64 a week; binds in 473 of 1,147 three-child cases.JudgementBeyond the comments
Section IV.C’s presumption of substantial hardship does not kick in until the payor is at 57 percent of net income, even though Line 7e itself reports only 40 percent at that point. This is the same units mismatch as Part one’s first ask, stated here because it is the standing condition the parenting-time and child care recommendations above operate under: a test that reads gross-derived income cannot see a burden priced in net income, however either credit is redesigned. The comments ask the Trial Court to measure the combined obligation, child support and child care together, on the basis it is actually paid from.
What would fix it: a ceiling, not a presumption. A presumption has to be raised by a party, argued, and decided, which costs more than it returns in most cases. A ceiling is arithmetic the form performs. The Worksheet would gain one line: the order is the lesser of Line 7d and 40 percent of the payor’s net weekly income.
Forty percent is Section IV.C’s own figure. The only change is the quantity it is measured against, from Line 3a available income to net pay.
What it would cost, measured on the same income grids as the rest of this site. With one child or two, a 40 percent ceiling changes nothing at all: no primary-custody order anywhere on either grid reaches it. With three children it reaches 41.2 percent (473 of 1,147) of the grid. At the worked example the order falls 1.1 percent, from $1,087.90 a week down to $1,075.64. It is a backstop for the worst cases, not a rewrite of the schedule.
The number the backstop catches is worth stating on its own. At primary custody with no child care at all, the worked example’s order is 40.5 percent of the payor’s net pay, past the point Section IV.C itself calls substantial hardship, while Line 7e reports 28.5 percent.
That is not one unlucky family. Across the same three-child grid the rest of this site uses, the order passes that threshold in 473 of 1,147 income combinations, and Line 7e passes it in none of them.
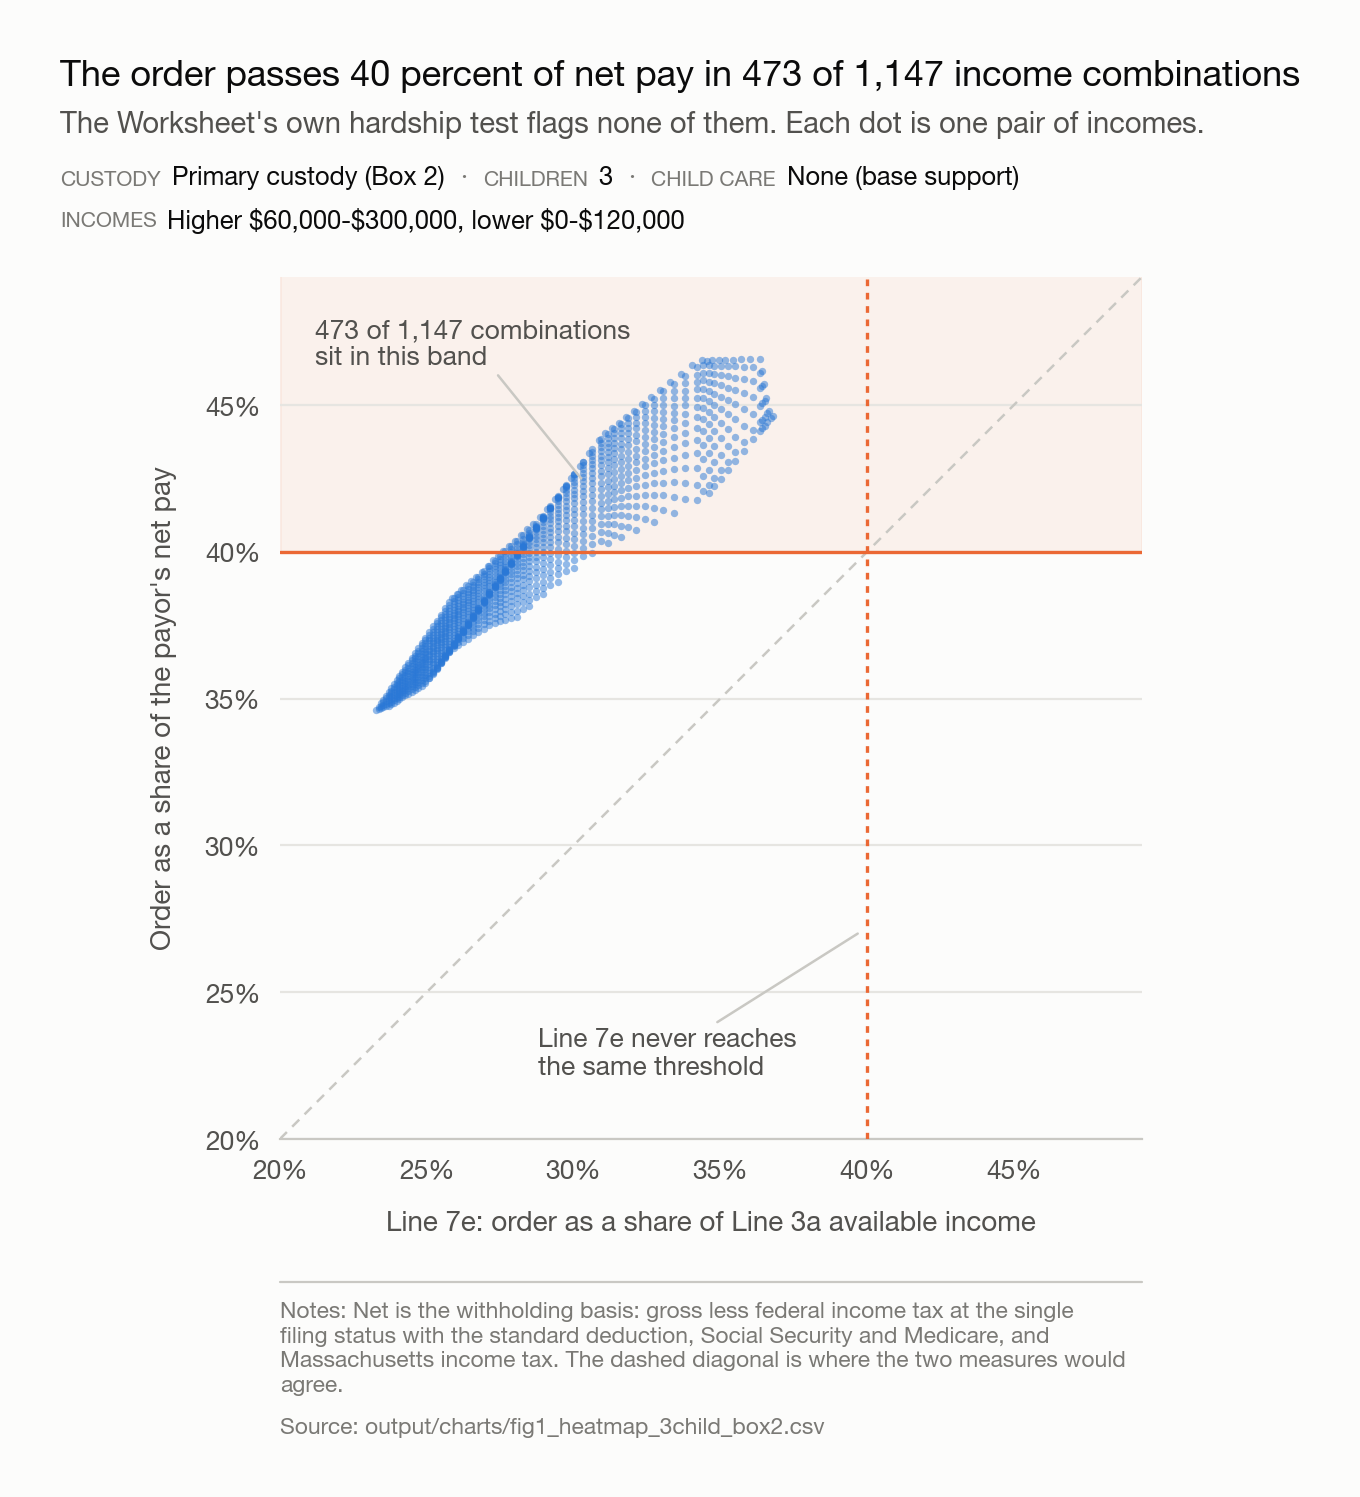
The order passes 40 percent of net pay in 473 of 1,147 income combinations
The Worksheet's own hardship test flags none of them. Each dot is one pair of incomes.
Across is what Line 7e prints; up is what the order actually takes. Every point sits above the dashed diagonal because Line 7e divides by a gross-derived figure, and the widest gap on this grid is 13.0 percentage points. Net is the withholding basis: gross less federal income tax at the single filing status with the standard deduction, Social Security and Medicare, and Massachusetts income tax.
Source: model/charts/fig12_net_pay_ceiling.py ·
data (CSV)
A net ceiling is not a new idea, though no state applies one to the order. Congress already caps what may be withheld from a paycheck for child support, the federal withholding ceiling, 15 U.S.C. § 1673(b)(2). That limits what an employer may withhold from a paycheck, not what a court may order, so the Commonwealth can order more than an employer may lawfully withhold; the excess remains owed. The federal law finding on this site has the full picture: with child care claimed, a real share of the Worksheet’s own grid crosses it, and none does with no child care claimed at all.
Massachusetts already uses that measure. It just does not use it where the amount is decided. The Commonwealth’s own income withholding statute, G.L. c. 119A section 12, points at the federal ceiling three separate times, including a provision that reduces a payment automatically once it would exceed what the Consumer Credit Protection Act permits, with no motion and no written findings required. The Guidelines, the economic review and the Task Force report mention the Consumer Credit Protection Act zero times.
So the state measures this obligation in net pay when it collects and in gross pay when it decides the amount, and the two rules live in chapters that never refer to each other. What the statute book supports is measuring this obligation in net pay, and reducing an amount automatically once a fixed measure is exceeded. It does not supply the 25 or the 40.
Add a ten-row table that converts gross income to netAccurate to five cents a week. No dollar change.DisclosureBeyond the comments
A ceiling on net pay needs a net figure, and the Worksheet holds none. That is the real obstacle: five reviews have taken up gross versus net and none changed it.
It does not require anyone to do their taxes. Net income on the withholding basis is a straight line between a small number of breakpoints, so a conversion table takes the same shape Table A already uses, a starting amount and a rate per bracket, in ten rows. A parent reads one row and multiplies once. At the worked example, $3,865.38 of gross a week gives $2,689.11 net a week, and the table and the model agree to within five cents a week anywhere on the schedule.
The conversion itself is not new to these Guidelines either. The economic review commissioned for every cycle since at least 2013 converts gross to net exactly this way, using withholding tables and standard Social Security and Medicare, because the study the schedule is calibrated against is denominated in net. The table would publish the conversion the Commonwealth’s own consultant already performs and then sets aside.
When the children are split between the parents, the Worksheet cuts the order for care that costs more
This is the one proposal on the page that raises what a payor owes. It is here because the same model that produced the rest produced this, and leaving it out would have made the page a selection rather than a result.
Stop the Worksheet cutting the order when siblings are split between the parentsRaises the order where a split leaves the lower-income household short. In the worked example a split pays $581 a week against $835 for the same two children shared equally, $13,203 a year less, for care that costs more.CorrectionIn the comments to the Trial Court
Table B exists to capture economies of scale. Two children do not cost twice one child, so the factor is 1.40 rather than 2.00. Where the children are divided between the parents under Box 3, those economies are gone. Each household incurs the cost of a first child, and the two columns together generate a combined factor of 2.00. The arrangement is more expensive in total.
Line 6g then nets the two columns against each other, and the net is computed on the one-child schedule. So the more expensive arrangement produces the smaller transfer:
| Arrangement, two children | Payor’s share of the children’s care | Order |
|---|---|---|
| Box 1 — shared equally, both children | 2 x 50% = 1.0 child-share | $835/wk |
| Box 3 — one child residing with each parent | 1 x 100% = 1.0 child-share | $581/wk |
That is a 30 percent drop, $13,203 a year, on identical care responsibility. The netting also treats the lower earner’s column obligation as though it were payable and sets it off in full, and Line 5c’s low-income protection does not reach them, because it engages only where the other parent’s Line 3a is $391 or less.
This point does not favour payors. It cuts against whichever parent has the lower income.
Suggested language, added to the Commentary to Section II.D:
“Where the children are divided between the parents under Box 3, each household incurs the cost of a first child, and the combined Table B factors applied across the two columns will exceed the factor that would apply were the children in one household. The netting at Line 6g does not account for this. Where a split arrangement leaves either household with materially less than it would receive were the same children in a single household, Section IV.B may apply.”
This is a correctness point about one provision, not a claim about typical outcomes; there is no published figure for how often Box 3 is used. There is a contrary view and it deserves stating: in a split, each parent directly bears their own child’s costs, so less needs to transfer. The point is not that netting is wrong in principle, but that it is computed on a schedule assuming economies of scale the arrangement has eliminated.
Three gaps leave a judge without a figure, and none of them changes an order
Three gaps that leave a judge without a figure. None of them changes any order.
None of these three changes a dollar figure. Two of them come from the Massachusetts Family Advocacy Coalition, which generally argues the other side of this whole subject, in a 72-page comment it filed with the 2024-2025 Task Force; that Task Force rejected both. They are proposed here anyway, because an accurate Worksheet should catch understatement in either direction, not only the one this site has argued so far.
Add a financial disclosure checklist, signed under the penalties of perjuryNo dollar change.DisclosureIn the comments to the Trial Court
MFAC’s own words:
“There is no Guideline to curb obstructionist tactics that parties, particularly economic superior parties and abusers, use to evade mandatory financial disclosure requirements… Add a disclosure checklist to the Guidelines Worksheet for each party to complete and sign under the penalty of perjury.”
Five states already put a sworn statement directly on the worksheet document itself, not on a separate form. New York’s reads, in part, “under the penalties of perjury, under the laws of New York… that the foregoing is true.” Washington’s: “I declare under penalty of perjury under the laws of the State of Washington the information contained in these Worksheets is complete, true, and correct.” Hawaii, Iowa and Indiana carry versions of the same line.
Massachusetts’s Worksheet, CJ-D 304, has none of it. A search of the form’s own fields and its printed text for “perjury,” “certif,” “signature,” “sworn” and “declare” returns zero hits. The form has a line for who prepared it and when, and no line that puts either parent’s own name to the numbers entered.
The fix: a signature line at the foot of the Worksheet, one per party, along the lines of “I certify under the penalty of perjury that the income, child care and health insurance figures I entered on this Worksheet are true and complete to the best of my knowledge.” It would catch a payor who understates income, which is what MFAC is asking for. It would also catch a parent who overstates a child care claim, the same claim the child care finding on this site says currently needs nothing more than that parent’s own word.
Move the deviation findings onto the Worksheet from the separate formNo dollar change.DisclosureIn the comments to the Trial Court
MFAC’s own reasoning:
“The current deviation process works against custodial parents. First, many custodial parents are unaware they can ask for an upward deviation to increase support.”
Today the four findings a judge must make to depart from the Worksheet amount live on a separate form, CJ-D 305, not on the Worksheet itself. New Jersey’s own worksheet carries a “Comments, Rebuttals, and Justification for Deviations” section directly below its order line. Missouri keeps the deviation analysis inside the same numbered form as the calculation.
The fix: move CJ-D 305’s four required findings onto CJ-D 304, printed on the same page the presumptive amount is computed, with a plain-language note that either parent may ask for a deviation up or down. It is close to a straight port of MFAC’s own proposal. It would also start producing a number the findings page on this site already says is missing: how often a deviation motion that the parties didn’t simply agree to actually succeeds.
Give uninsured medical costs a formula instead of leaving them case-by-caseNo change to the guidelines amount. Its main effect is to lower the recipient's cost of collecting what is already owed.JudgementBeyond the comments
The Guidelines say in their own words that they have no formula here. The recipient pays the first $250 a year of routine out-of-pocket and uninsured medical, dental and vision costs alone. Above that, Section II.J.1 says only that the Court “shall enter an order allocating expenses between the parties,” and may, but need not, use the Line 3c income share to do it. For the expensive kind, which the Guidelines illustrate with orthodontia and psychological counseling, there is no rule at all: absent an agreement between the parents they are “treated on a case-by-case basis,” and the commentary adds that “the guidelines do not establish any presumptive allocation of these costs.” Case-by-case means whoever can least afford to argue it in court is the one who ends up absorbing it or negotiating it away.
Missouri, Washington and Vermont all worksheet this the same way Massachusetts already worksheets child care. Missouri’s Form 14 has a line for uninsured extraordinary medical costs, divided among the children when a per-child figure isn’t available. Washington’s worksheet has an “Uninsured Monthly Healthcare Expenses Paid for Child(ren)” line, one column per parent. Vermont’s order form adds “Extraordinary Medical Expenses” directly into the calculation.
The fix: a new line, in the same family as the existing child care lines, that replaces “case-by-case” with a formula for the costs above the recipient’s first $250. The point of this ask is that a formula exists at all, not which basis it uses or which parent it favors, so the line should take its basis from whatever the Worksheet uses to allocate child care, whatever that turns out to be, rather than fixing one on its own. Today that is the pre-transfer Line 3c share Line 6b uses; if the comments’ own child care redline above is adopted, this line should move to the same post-transfer basis, so the two stay consistent with each other instead of pulling in different directions. Either parent stays free to ask for a different split by agreement or through the new deviation section above.
A formula does not by itself decide who pays more here; it decides whether the split gets argued over every time or set in advance. In most families the parent who takes a child to the orthodontist or the counselor is the recipient, so a formula that needs no motion or agreement mainly lowers the recipient’s cost of collecting it, whatever basis the line ends up using.
The numbers behind this page
Every figure above is printed by model/recommendations.py,
checked by model/test_recommendations.py,
and reproduced in the full run at
model/runs/recommendations-run-2026-09-09.txt.
The fifty-jurisdiction figures come from the same fifty-state dataset used throughout this site,
tier-50-2026-09-05.json; Washington and
California’s own basis and income ceilings are in
ceilings-2026-09-06.json.