
Parenting time
Massachusetts orders the most child support for joint custody in the nation, and the discount for equal time is negligible
With the children about a third of the time, the paying parent's order at the worked example is $1,087.90 a week. With them half the time, it is $1,012.73. The difference is $75.17 a week, or 6.9 percent. The form has no line for parenting time, so the discount comes from the income gap alone.
What equal parenting time takes off the order in Massachusetts, at the worked example
The discount shrinks as the payor’s share of income rises: 77.6% at a 56.3% share, 6.9% at the worked example’s 87.7%
What it takes off in Utah at the same incomes. Montana 52%, Hawaii 52%, Minnesota 48%
Verified against the form's own calculation scripts
The worked example below runs three children, equal parenting time, the payor's income and the other parent's income entered as the Worksheet requires. They are Worksheet figures from a real Massachusetts case, and neither is either parent's current income. I pay child support in Massachusetts myself, so I have a stake in the outcome; a reader should be able to check whether the arithmetic changes when the numbers move.
The model that produced every figure on this page is model/box1_fix.py, checked against model/worksheet.py and against the form's own official calculation scripts in model/runs/official-xfa-vs-model-2026-09-05.txt.
The form’s primary-custody box already assumes the paying parent has the children a third of the time
The Guidelines build Box 2, the primary-custody calculation, around a paying parent who has the children about one night in three. Box 1 is the equal-time box. Moving from Box 2 to Box 1 is the only change between the two orders above. So “a third” is where the form starts. Moving from a third to a half is worth 6.9 percent.
The discount is small because no line on the form measures time
The equal-time credit is the gap between the two parents’ income shares and nothing else. The wider the income gap, the less equal time is worth.
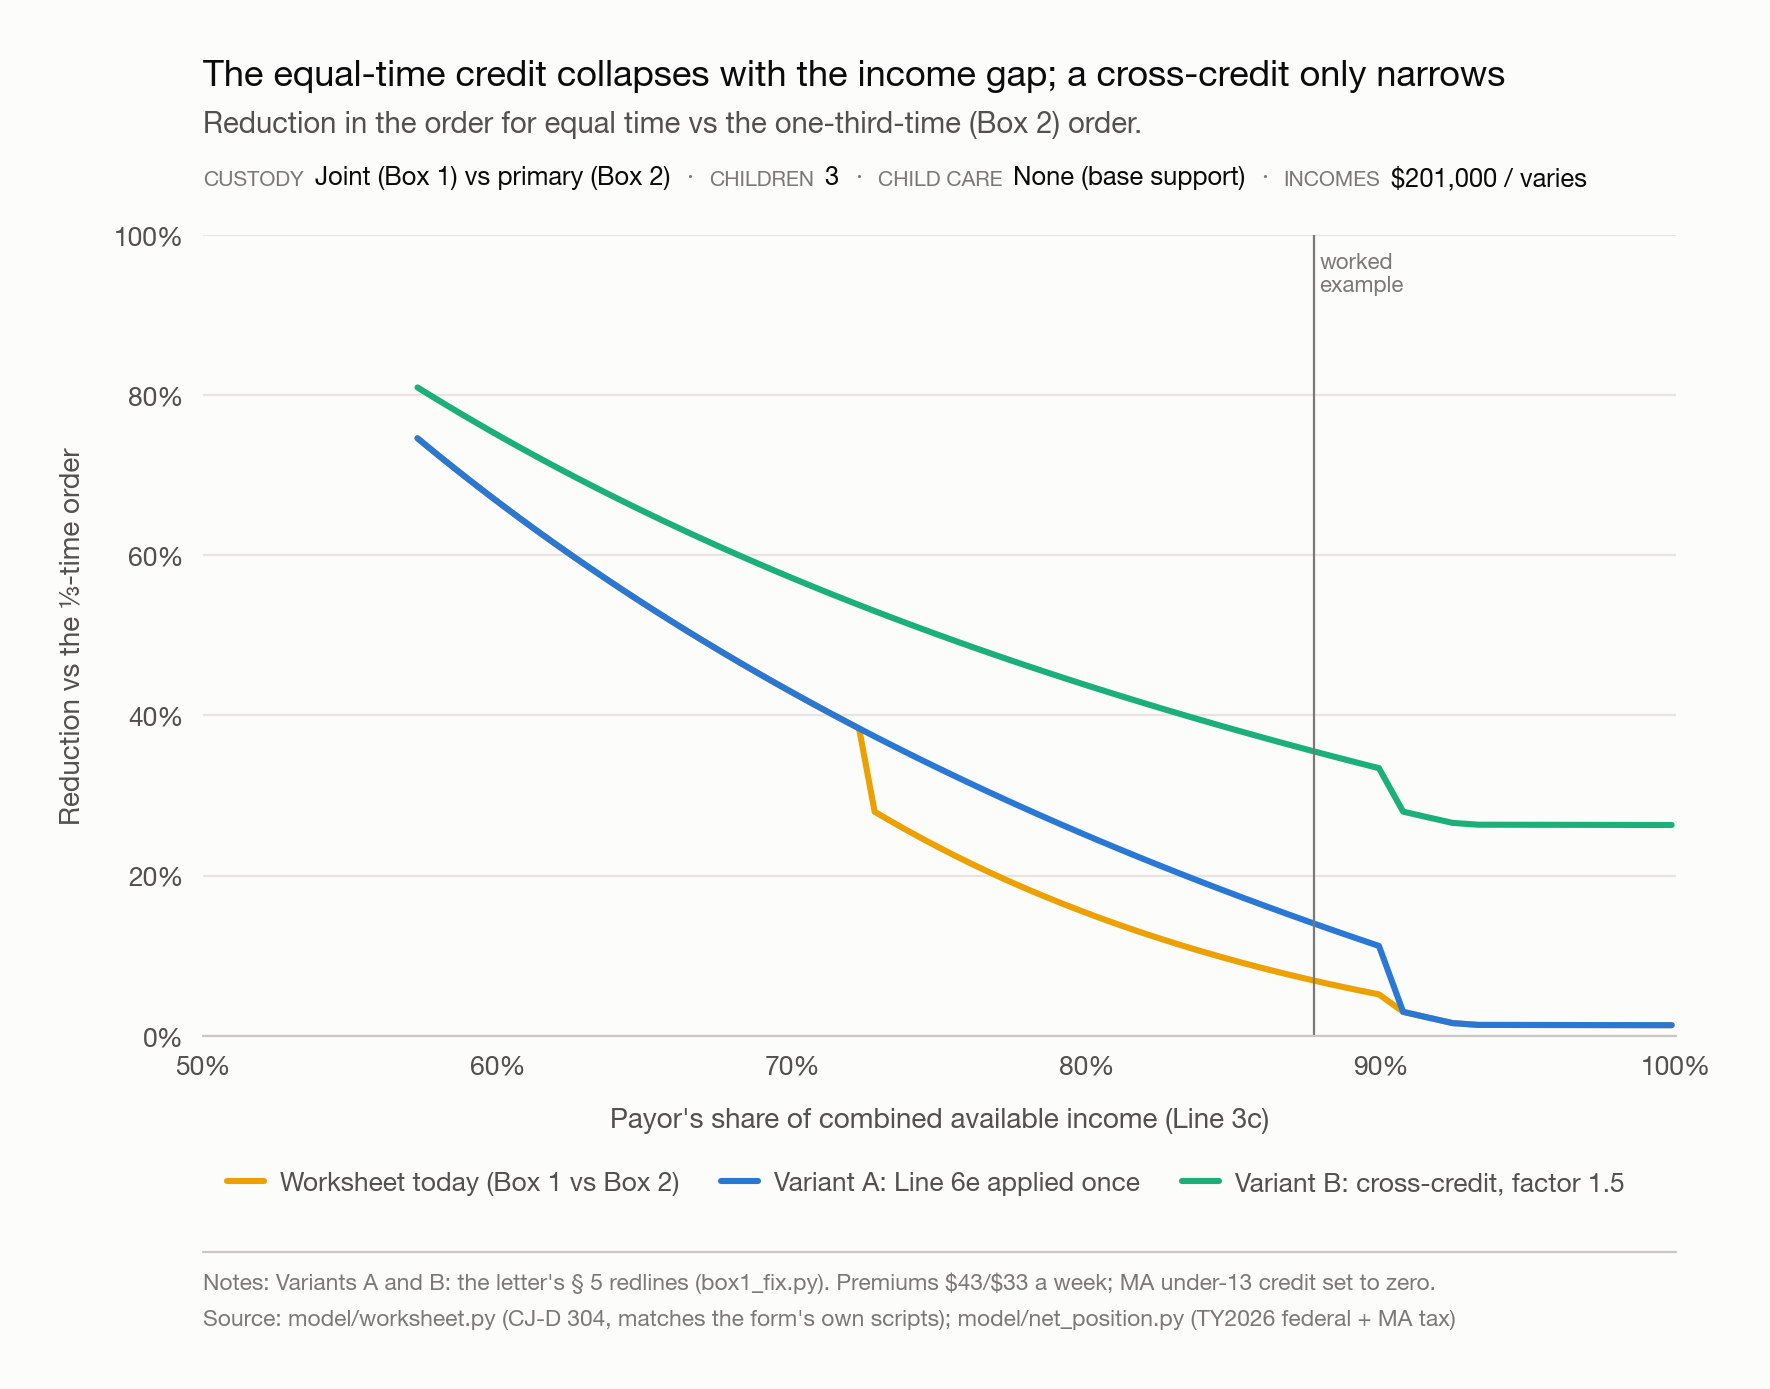
The Worksheet's equal-time credit collapses as the income gap widens.
The discount for equal time, against the primary-custody order, falls from about 75 percent at a 57 percent payor income share to 7 percent at 88 percent and 1 percent at 96 percent, because no parenting-time quantity enters any line.
Variant A, applying Line 6e once, raises the discount to 14.0 percent. Variant B, the cross-credit design 18 states and DC use at a 1.5 duplication factor, raises it to 35.5 percent and stops it collapsing. This chart's continuous sweep runs from a 57.3 percent payor income share. The discrete sweep behind the numeral above runs further than either this chart or the table below displays, reaching a 56.3 percent share, where the discount is 77.6 percent.
Source: model/box1_fix.py · model/charts/fig3_credit.py ·
data (CSV)
The chart also shows the two redlines in the comments. Variant A applies the Line 6e limit once and gives $935.06. Variant B rebuilds the credit as the cross-credit 18 states and DC use and gives $701.30, a 30.8 percent drop from today’s $1,012.73. The count and the factor are Oldham and Venohr’s (The Relationship Between Child Support and Parenting Time, 54 Fam. L.Q. 141, 152-53 (2020)), who record that those states raise the basic obligation by 50 percent for the expenses both households duplicate; a few use no multiplier, or one other than 1.5. Neither redline adds a term for how much time either parent actually has.
Research on custody decided mainly by a financial incentive finds children can fare worse under it (Fernández-Kranz, Roff and Sun, Journal of Economic Behavior & Organization 189 (2021)), an argument against pricing parenting time by formula in either direction, whether a credit shrinks or grows. Both variants above still price it by formula; the caution applies to them the same way it applies to today’s line.
Method: the credit at eight other incomes for the other parent
| Other parent's weekly gross | Payor's share of combined income | Box 1 order | Discount against Box 2 |
|---|---|---|---|
| $2,500 | 60.8% | $340 | 64.5% |
| $1,800 | 68.4% | $536 | 46.2% |
| $1,200 | 76.6% | $826 | 20.5% |
| $900 | 81.5% | $920 | 13.3% |
| $700 | 85.1% | $977 | 9.2% |
| $570 (worked example) | 87.7% | $1,013 | 6.9% |
| $400 | 91.2% | $1,075 | 2.6% |
| $250 | 94.6% | $1,103 | 1.3% |
Below $391 a week of the other parent’s available income (the bottom two rows), Line 5c substitutes
a fixed floor amount instead of a percentage of income, so the order stops behaving like a
cross-credit. (Source: model/runs/box1-fix-run-2026-09-05.txt, printed by model/box1_fix.py.)
Nothing between the Worksheet’s total and its credit asks how many nights either parent has
Both boxes on the form (CJ-D 304) start from the same total at Line 4c: $1,240.73 a week at the worked example (three children, a payor at $201,000 a year, the other parent at $570 a week). Line 5b splits that by income share, giving the payor 87.68 percent, or $1,087.90; this is the Box 2 order. Box 1 then subtracts one credit at Line 6g, the payor’s own Line 6e, capped low because the payor’s column’s Line 6d sits below 10 percent. The credit comes to $75.17, leaving $1,012.73. Nothing between Line 4c and Line 6g asks how many overnights either parent has.
$75 of $1,088 the equal-parenting discount at the worked example against the order Box 2 would produce for the same family: 6.9 percent, and no line in the calculation measures time
What a cross-credit formula would say
Massachusetts doesn’t say how much cost two households duplicate when they share custody. Eighteen states and the District of Columbia answer that with a cross-credit (which states, and how it works): multiply the basic obligation by a duplication factor (Indiana’s commentary sets 1.5) before subtracting the lower earner’s share.
Solving the Box 1 arithmetic backward through that formula turns up a coincidence: the 6.9 percent discount for full equal time is close to what a cross-credit would give a parent with the children one night in three, a different “third” from the Box 2 assumption above, backed out of another state’s formula rather than anything Massachusetts’s own form assumes.
33.3% at factor 1.5 · 46.9% at factor 2.0 the overnight share the Box 1 order at the worked example implies under a standard cross-credit. Never quote one of these numbers without its factor
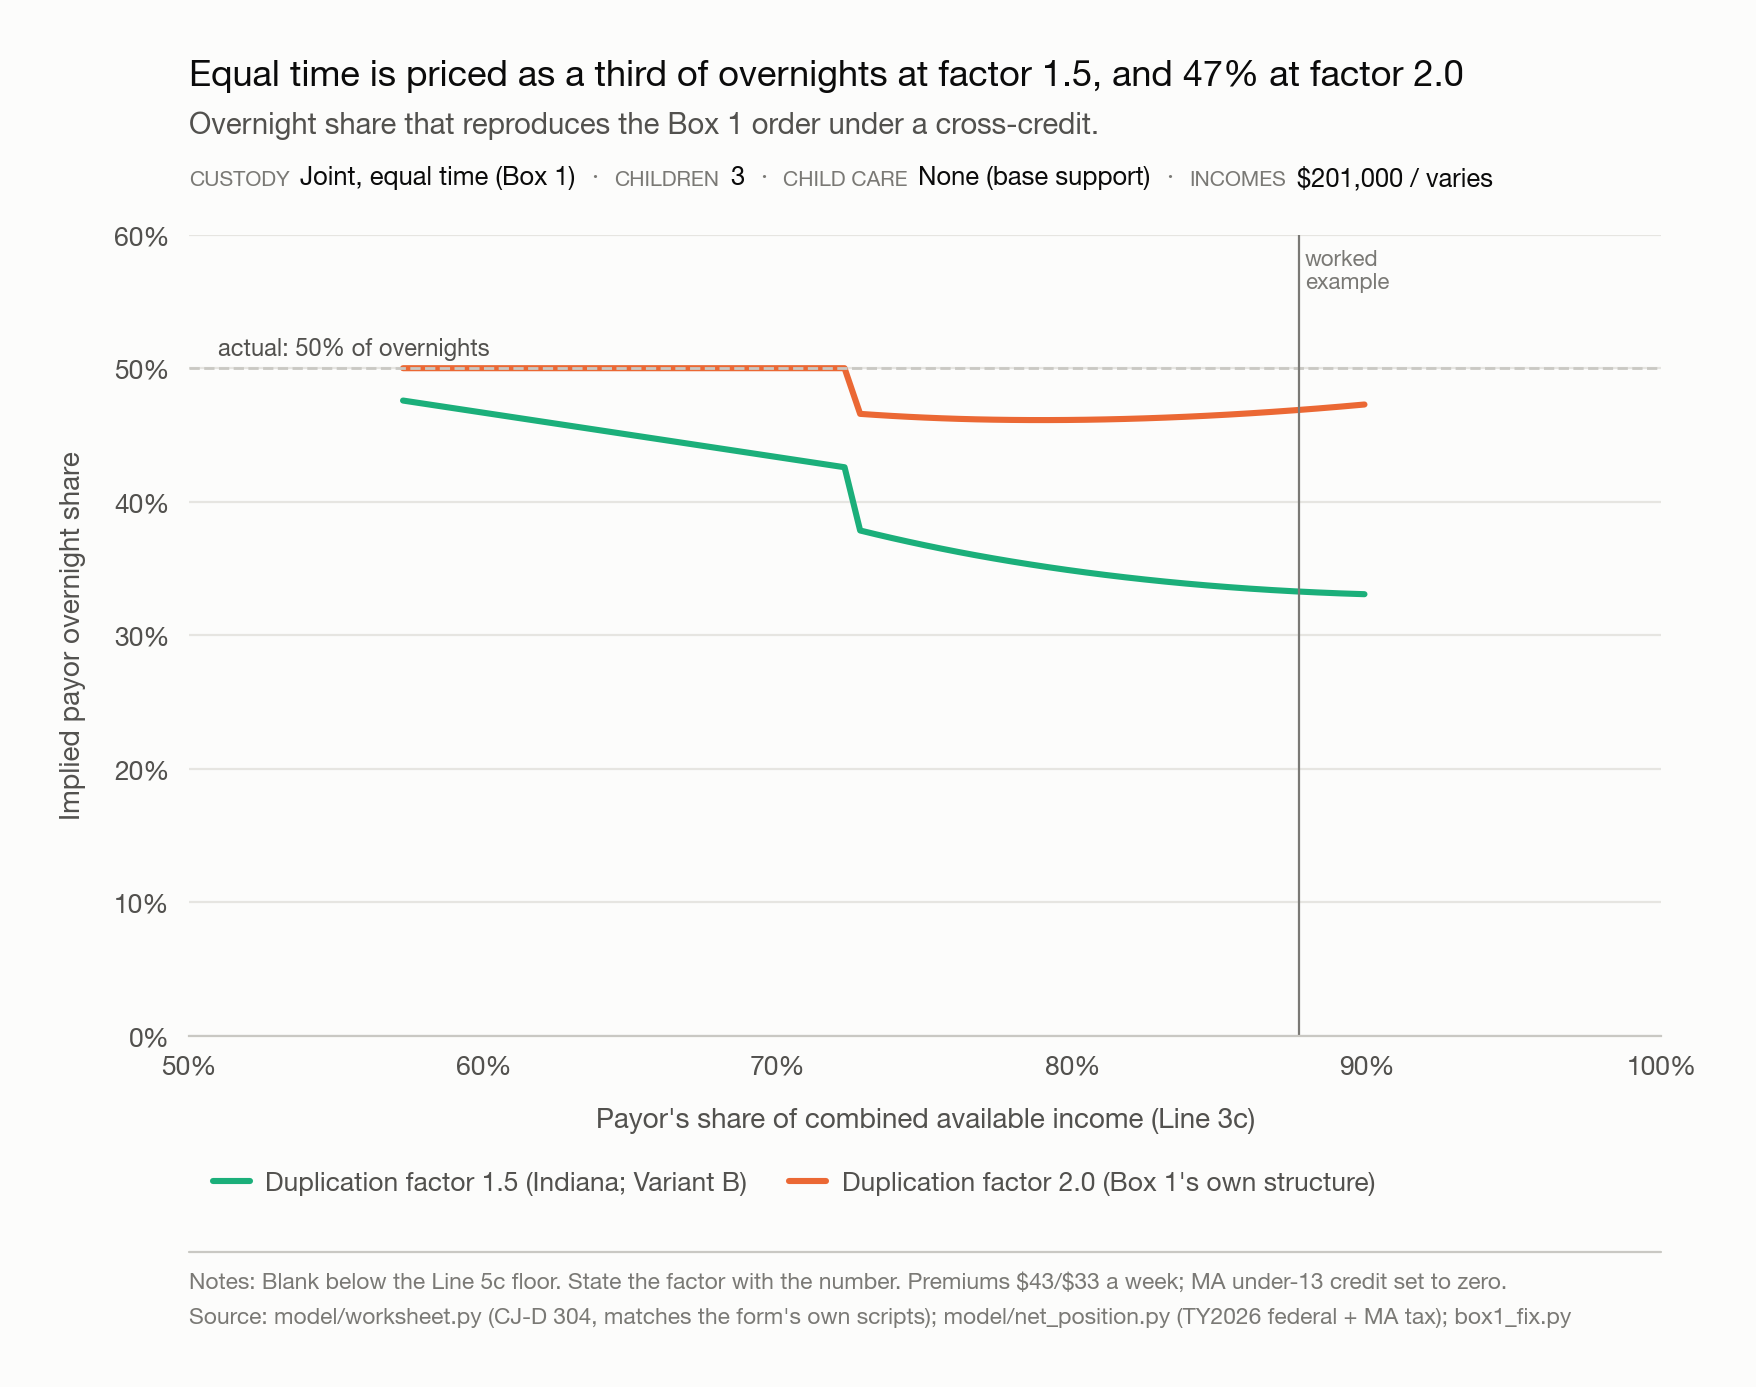
The equal-time credit is what a standard formula pays a parent who has the children one night in three.
The overnight share that reproduces the Box 1 order under a standard cross-credit, at the stated factor. Never quoted without the factor beside it.
Blank below the Line 5c floor, where the order is no longer a cross-credit and no overnight share can be backed out of it.
Source: model/box1_fix.py · model/charts/fig3_credit.py ·
data (CSV)
At the 1.5 factor, neither implied share, 33.3 percent or 46.9 percent, reaches the 50 percent this parent actually has.
Federal law should define joint custody as any schedule giving each parent at least a third of the time
The Worksheet already treats a third of the time as its starting point. Box 2 assumes the children have “a primary residence with one parent and spending approximately one-third of the time with another parent,” and the 2025 Guidelines let a court deviate once a parent has well over a third of the time but less than half, § II.D.4, deviation factor IV.B.9. Between a third and a half, nothing on the form does the arithmetic. A judge decides it, case by case.
Massachusetts tried pricing that middle range once already, and undid it. Its 2017 Commentary removed a similar provision and gave its reason: “The 2012 change increased litigation and acrimony between parents, shifted the focus from a parenting plan that is in the best interests of the children to a contest about a parenting plan that attempts to reduce a child support order, and failed to create the consistency in child support orders that it sought to create.” It added a rule of its own: “Child support should not be driving the parenting plan.” The 2025 Guidelines brought the same kind of pricing back, as § II.D.4.
Federal law should say what joint custody is, so that no night of parenting time is worth fighting over. Once each parent has the child at least a third of the time, the order should follow the cross-credit, weighted by each parent’s share of the time, and be capped at 30 percent of net pay, the same ceiling the federal-law finding proposes. That is the harm the 2017 Commentary already named: parents litigating over an extra day, and child support driving the parenting plan.
9 of 50 states, including New York, where splitting time equally lowers the order not at all from a one-third schedule
Every figure here is one worked example at equal time, though the mechanism is the form’s own
Every figure on this page comes from one worked example: three children, equal parenting time, no child care claimed, at the incomes stated. The mechanism, Box 1's discount equalling the payor's own capped Line 6e, is a property of the form itself and does not depend on the worked example; the specific dollar amounts and percentages do. The primary-custody order appears only as the baseline the equal-time discount is measured from.
Per person, the standing caveat applies here too: nothing on this page compares what the payor keeps for himself against what each member of the recipient's household holds. See the hardship-test and child care findings for that comparison at the same worked example.
Check it yourself
Every number above is printed by a committed script and backed by a CSV of the plotted values.
model/box1_fix.pyComputes the Box 1 discount, the two redlined variants, and the overnight share a cross-credit would need to match the order.- The full printed run Behind every figure on this page.
- fig3_credit_collapse.csv The data behind Exhibits E08 and E09.